Skip to content
chartzone LOGO

Chartzone

Master the Trend, Day by Day.

Primary Menu
  • Home
  • Store
  • Analysis Type
    • Multi Timeframe
    • Multi Input Set
    • Multiple Chart
    • Sector Analysis
    • Case Studies
    • Single Chart
  • Market Type
    • Crypto
    • Forex
    • Futures
    • Stocks
  • Account / Sign In
  • Cart
Light/Dark Button
TPR
  • Home
  • Posts page
  • USDJPY

USDJPY

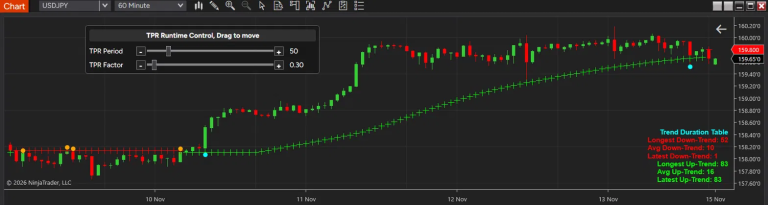
How to Use TPR to Trade Forex Trend Reversals Without Confusing Them with Normal Pullbacks image
  • Downtrend
  • Forex
  • Minute
  • Multi Input Set
  • Multiple Chart
  • Pullback
  • Reversal
  • Uptrend

How to Use TPR to Trade Forex Trend Reversals Without Confusing Them with Normal Pullbacks

ChartZone November 15, 2026

Share Your TPR Method. Help Other Traders Learn. Get Rewarded.

Request a FREE TPR Market Analysis

TPR Setup & Usage

  • TPR PRO Runtime Control
  • Multi-Parameter TPR Analysis: Understanding Trend Development Through Multiple Perspectives
  • PullBack Channel vs. Trailing Band
  • Trailing Band vs. PullBack Channel
  • How Trailing Band Width Changes the Behavior of TPR: Building Dynamic Profit Targets, Trailing Stops, and Support & Resistance

Recent Posts

  • image
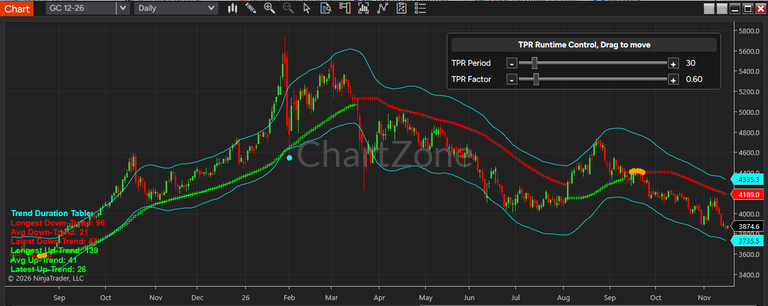
    Gold Futures Hit a 52-Week Low: Is Gold Entering a New Bearish Trend? TPR Technical Analysis
  • image
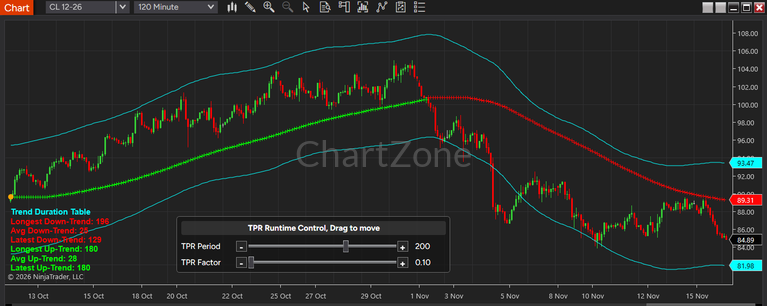
    Crude Oil Futures Drop 3%: Using TPR to Analyze WTI’s Downtrend and Pullback Structure
  • Nasdaq Futures Sell-Off: How TPR Identifies Trend Continuation Versus a Bearish Reversal
  • image
    Bitcoin Below $70,000: Using the TPR Indicator to Analyze a Potential Crypto Market Trend Reversal
  • image
    How to Use TPR to Trade Forex Trend Reversals Without Confusing Them with Normal Pullbacks

Related Articles

image
  • Daily And Above
  • Downtrend
  • Futures
  • Reversal
  • Single Chart
  • Uptrend

Gold Futures Hit a 52-Week Low: Is Gold Entering a New Bearish Trend? TPR Technical Analysis

ChartZone November 17, 2026
image
  • Case Studies
  • Downtrend
  • Futures
  • Minute
  • Reversal
  • Single Chart

Crude Oil Futures Drop 3%: Using TPR to Analyze WTI’s Downtrend and Pullback Structure

ChartZone November 17, 2026
image
  • Analysis Type
  • Case Studies
  • Downtrend
  • Futures
  • Minute
  • Single Chart

Nasdaq Futures Sell-Off: How TPR Identifies Trend Continuation Versus a Bearish Reversal

ChartZone November 17, 2026
image
  • Crypto
  • Daily And Above
  • Downtrend
  • Multi Input Set
  • Multiple Chart
  • Pullback
  • Reversal
  • Sector Analysis

Bitcoin Below $70,000: Using the TPR Indicator to Analyze a Potential Crypto Market Trend Reversal

ChartZone November 16, 2026
  • Home
  • Affiliate
  • About us
  • Contact Us
  • Group License
  • Terms & Conditions
    • Privacy Policy
    • Refund Policy
    • Risk Disclosure
    • Subscriber Agreement
  • Platforms
  • FAQ
  • Youtube
Copyright © 2026 All rights reserved. |  By Patternsmart