Skip to content
chartzone LOGO

Chartzone

Master the Trend, Day by Day.

Primary Menu
  • Home
  • Store
  • Analysis Type
    • Multi Timeframe
    • Multi Input Set
    • Multiple Chart
    • Sector Analysis
    • Case Studies
    • Single Chart
  • Market Type
    • Crypto
    • Forex
    • Futures
    • Stocks
  • Account / Sign In
  • Cart
Light/Dark Button
TPR
  • Home
  • Posts page
  • BTCUSD

BTCUSD

Bitcoin Below $70,000: Using the TPR Indicator to Analyze a Potential Crypto Market Trend Reversal image
  • Crypto
  • Daily And Above
  • Downtrend
  • Multi Input Set
  • Multiple Chart
  • Pullback
  • Reversal
  • Sector Analysis

Bitcoin Below $70,000: Using the TPR Indicator to Analyze a Potential Crypto Market Trend Reversal

ChartZone November 16, 2026

Share Your TPR Method. Help Other Traders Learn. Get Rewarded.

Request a FREE TPR Market Analysis

TPR Setup & Usage

  • TPR PRO Runtime Control
  • Multi-Parameter TPR Analysis: Understanding Trend Development Through Multiple Perspectives
  • PullBack Channel vs. Trailing Band
  • Trailing Band vs. PullBack Channel
  • How Trailing Band Width Changes the Behavior of TPR: Building Dynamic Profit Targets, Trailing Stops, and Support & Resistance

Recent Posts

  • image
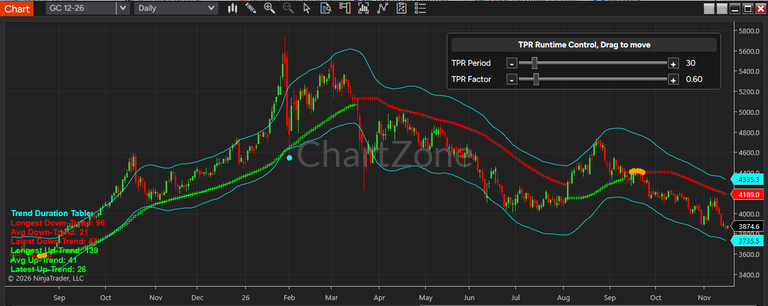
    Gold Futures Hit a 52-Week Low: Is Gold Entering a New Bearish Trend? TPR Technical Analysis
  • image
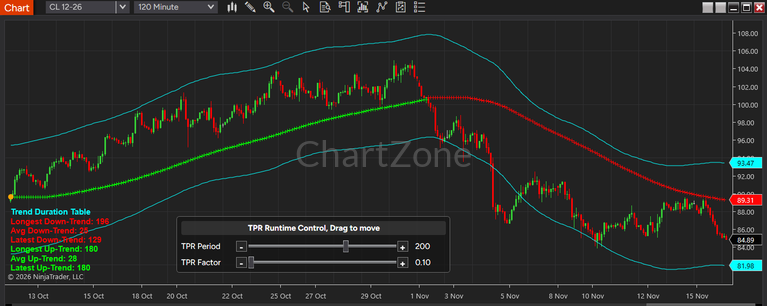
    Crude Oil Futures Drop 3%: Using TPR to Analyze WTI’s Downtrend and Pullback Structure
  • Nasdaq Futures Sell-Off: How TPR Identifies Trend Continuation Versus a Bearish Reversal
  • image
    Bitcoin Below $70,000: Using the TPR Indicator to Analyze a Potential Crypto Market Trend Reversal
  • image
    How to Use TPR to Trade Forex Trend Reversals Without Confusing Them with Normal Pullbacks

Related Articles

image
  • Daily And Above
  • Downtrend
  • Futures
  • Reversal
  • Single Chart
  • Uptrend

Gold Futures Hit a 52-Week Low: Is Gold Entering a New Bearish Trend? TPR Technical Analysis

ChartZone November 17, 2026
image
  • Case Studies
  • Downtrend
  • Futures
  • Minute
  • Reversal
  • Single Chart

Crude Oil Futures Drop 3%: Using TPR to Analyze WTI’s Downtrend and Pullback Structure

ChartZone November 17, 2026
image
  • Analysis Type
  • Case Studies
  • Downtrend
  • Futures
  • Minute
  • Single Chart

Nasdaq Futures Sell-Off: How TPR Identifies Trend Continuation Versus a Bearish Reversal

ChartZone November 17, 2026
image
  • Crypto
  • Daily And Above
  • Downtrend
  • Multi Input Set
  • Multiple Chart
  • Pullback
  • Reversal
  • Sector Analysis

Bitcoin Below $70,000: Using the TPR Indicator to Analyze a Potential Crypto Market Trend Reversal

ChartZone November 16, 2026
  • Home
  • Affiliate
  • About us
  • Contact Us
  • Group License
  • Terms & Conditions
    • Privacy Policy
    • Refund Policy
    • Risk Disclosure
    • Subscriber Agreement
  • Platforms
  • FAQ
  • Youtube
Copyright © 2026 All rights reserved. |  By Patternsmart