A reversal on the 5-minute chart does not necessarily mean the 15-minute trend has reversed. Traders need to distinguish short-term changes in price direction from a genuine change in the broader market structure.
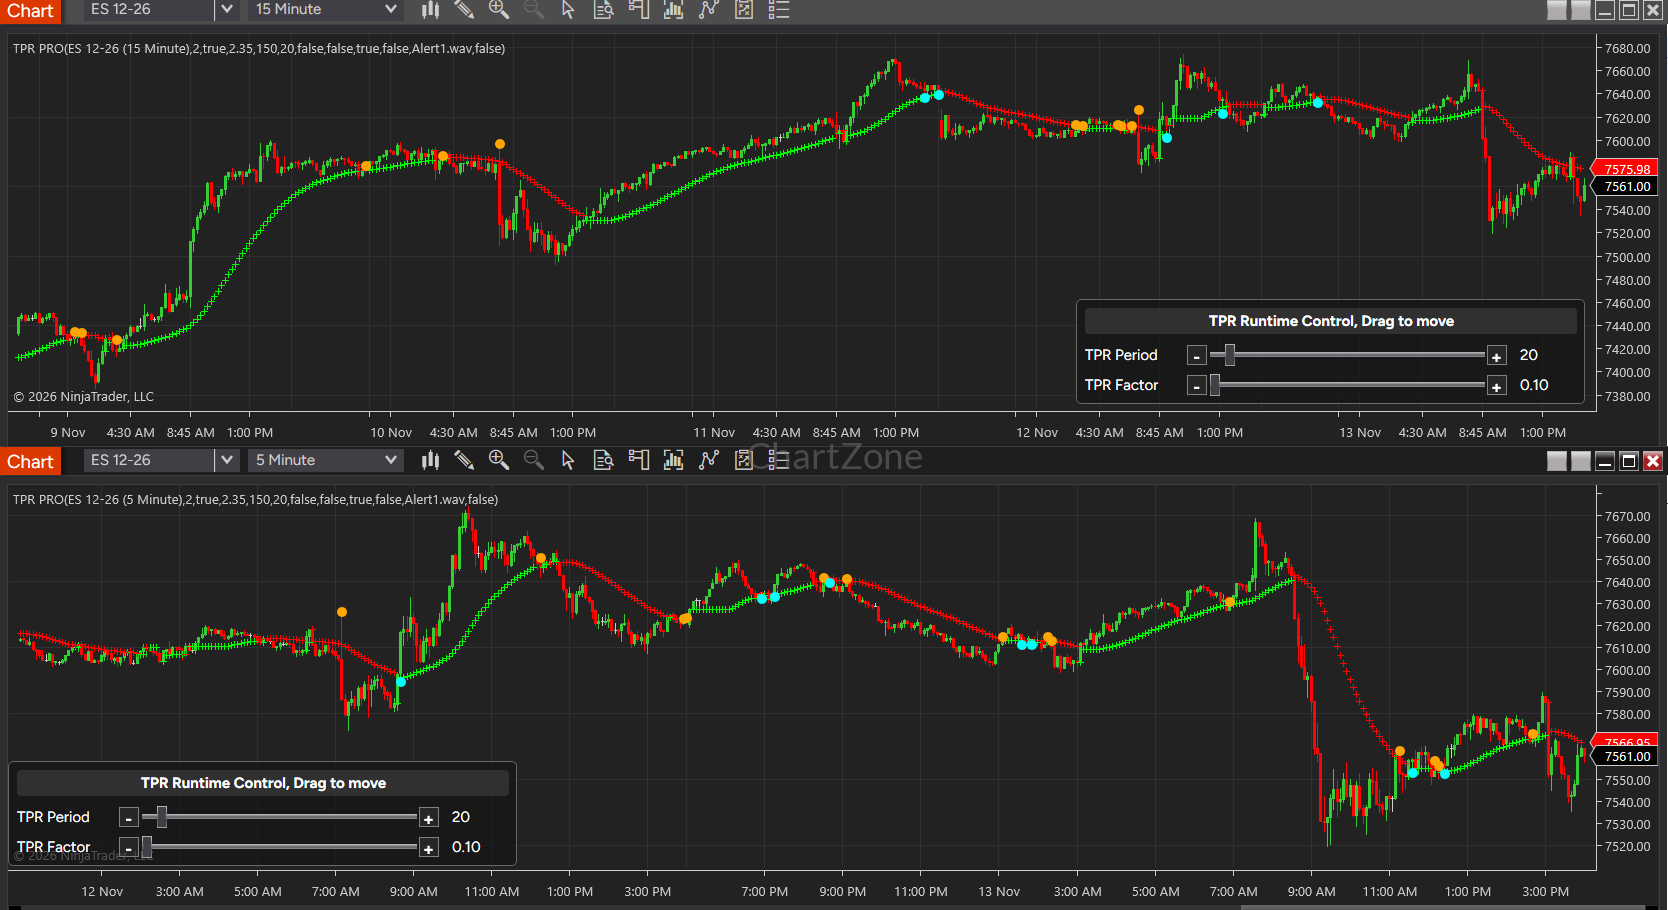
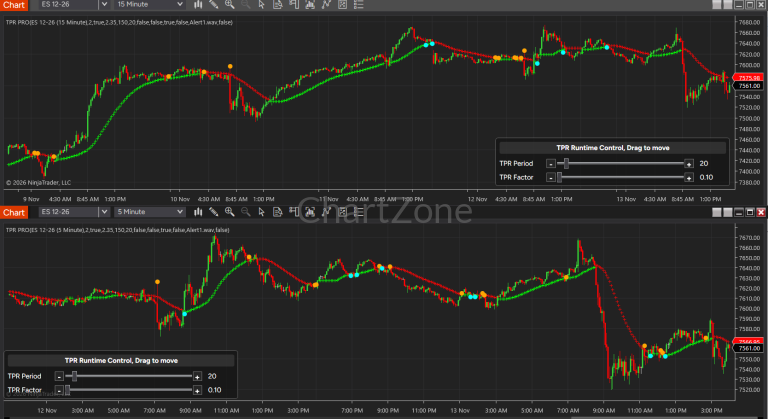
1. Chart identification
| Item | Upper chart | Lower chart |
|---|---|---|
| Instrument | ES 12-26 | ES 12-26 |
| Market | E-mini S&P 500 Futures | E-mini S&P 500 Futures |
| Timeframe | 15-minute | 5-minute |
| Platform | NinjaTrader | NinjaTrader |
| TPR version | TPR PRO | TPR PRO |
| Visible Runtime Control | Period 20, Factor 0.10 | Period 20, Factor 0.10 |
The two charts show different levels of market structure:
- 15-minute: Provides the broader intraday trend context.
- 5-minute: Reveals more detailed price movements, short-term trend changes, and potential rebound areas.
2. Identifying the TPR elements
Following the project’s TPR Chart Visual Reference:
- Green dotted line: Up Trend Line.
- Red dotted line: Down Trend Line.
- Orange and cyan circular markers: Potential Rebound Signals.
3. What the charts reveal about ES futures
A. The 15-minute chart: Understanding the broader trend
The upper chart shows several transitions between upward and downward TPR trend structures during November 9–13.
Several observations are particularly relevant:
1. An upward trend does not eliminate the possibility of a significant pullback.
During November 9–11, the chart displays an extended upward phase, represented by the green Up Trend Line. However, this advance is interrupted by a downward phase around November 10.
The important analytical question is whether a downward movement represents a temporary correction or the beginning of a broader structural change.
2. The market experiences another upward phase before weakening.
The green trend structure reappears after the November 10 decline and continues into November 11. Subsequently, the chart displays a red Down Trend Line.
This illustrates why traders should not interpret every short-term decline as a major reversal. The broader trend structure needs to be evaluated alongside price action.
3. November 13 presents a particularly important change in market behavior.
Near the November 13 morning session, ES experiences a sharp downward price movement.
At the right edge of the screenshot, the 15-minute chart still displays a red Down Trend Line. Although price has attempted to recover from the selloff, the visible recovery has not yet established a new upward TPR trend structure.
This is an important distinction: a rebound in price is not automatically a confirmed reversal.
B. The 5-minute chart: Identifying intraday pullbacks and rebound attempts
The lower chart provides more detailed information about the intraday movements, particularly during November 12–13.
There are several useful examples.
1. November 12: An upward movement following a downward phase
During the early portion of November 12, the 5-minute chart displays a downward trend structure.
Later, the green Up Trend Line appears as price begins to recover.
This transition illustrates how a lower timeframe can identify a developing upward movement before the broader market structure necessarily changes.
However, the appearance of a green trend line on the 5-minute chart should not automatically be interpreted as evidence that the 15-minute trend has reversed.
2. November 12 evening: A downward phase develops
The chart subsequently shows another transition toward a red Down Trend Line.
The downward structure continues into the early hours of November 13.
This demonstrates that intraday direction can change multiple times, even within a relatively short period.
3. November 13 morning: A sharp selloff followed by a recovery attempt
This is arguably the most educational section of the screenshots.
Around the morning session on November 13, ES experiences a substantial downward price movement.
The 5-minute chart shows:
- A sharp decline in price.
- A developing downward TPR structure.
- Subsequent price stabilization.
- An upward recovery attempt.
- A later weakening of the recovery.
The recovery is important because it demonstrates why traders should avoid assuming that every strong bounce represents a completed reversal.
At the right edge, the 5-minute chart again shows a red Down Trend Line, while price remains below the displayed trend line.
The 15-minute chart also retains its red Down Trend Line.
Consequently, the two timeframes are showing a broadly consistent downward trend structure at the end of the displayed data.
4. The key lesson: A lower-timeframe reversal is not necessarily a higher-timeframe reversal
This should be the central section of the article.
Consider two different situations:
| Market situation | 5-minute TPR | 15-minute TPR | Interpretation |
|---|---|---|---|
| Short-term bullish recovery | Green | Red | Potential countertrend rebound |
| Aligned bullish development | Green | Green | Improving multi-timeframe bullish alignment |
| Short-term bearish movement | Red | Green | Potential pullback within a broader uptrend |
| Aligned bearish development | Red | Red | Consistent multi-timeframe bearish structure |
These combinations are analytical frameworks, not automatic trading signals.
The important principle is that traders should evaluate the lower-timeframe movement in the context of the higher-timeframe trend.
A 5-minute upward transition can represent:
- A temporary recovery during a broader decline.
- The beginning of a deeper correction.
- An early stage of a potential larger reversal.
The subsequent price action and the development of the 15-minute TPR structure help distinguish between these possibilities.
5. Practical trading lessons from the ES example
Lesson 1: Avoid treating every rebound as a trend reversal
After a sharp decline, price often attempts to recover.
A strong bullish candle sequence may look convincing, but traders should examine whether the broader TPR trend structure has also changed.
Lesson 2: Use the 15-minute chart to establish directional context
The higher timeframe helps traders understand whether the current 5-minute movement is aligned with or moving against the broader trend.
This can help prevent traders from interpreting a countertrend recovery as an established bullish opportunity.
Lesson 3: Use the 5-minute chart to study the development of price structure
The lower timeframe provides additional detail about:
- Intraday trend transitions.
- Short-term corrective movements.
- Potential rebound areas.
- Failed recovery attempts.
- Changes in short-term momentum as reflected by price structure and TPR trend direction.
Lesson 4: Wait for evidence of structural change
A potential reversal should be treated as a developing scenario rather than an established fact.
The most useful question is not simply whether price has bounced, but whether the subsequent price action supports a sustained change in trend structure.
6. Conclusion: Read the trend before trading the reversal
The November 9–13 ES futures example demonstrates an important challenge in intraday futures trading: distinguishing a temporary price recovery from a genuine change in market direction.
The 5-minute chart reveals short-term opportunities to observe developing price movements, while the 15-minute chart provides the broader trend context.
The November 13 selloff is particularly instructive. Although price attempts to recover after the sharp decline, both timeframes display downward TPR trend structures at the right edge of the screenshots.
This reinforces one of the most important principles of multi-timeframe technical analysis:
A reversal on a lower timeframe is only a potential change in the broader market direction until the higher-timeframe structure provides supporting evidence.
By combining multiple TPR timeframes, traders can develop a more disciplined approach to evaluating intraday pullbacks, countertrend recoveries, and potential major reversals.
The objective is not to predict every market turning point. It is to understand which movements are consistent with the prevailing trend and which ones may represent a meaningful structural change.