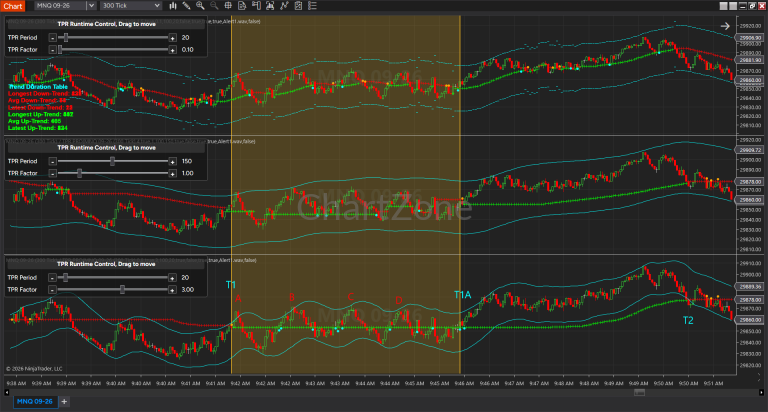
In the domain of professional quantitative development, cross-platform stability and microstructural tracking precision dictate the long-term viability of a technical model. While Multi-Timeframe (MTF) implementations are frequently introduced to map macro-trend metrics onto micro-execution layers, the Trend Pullback Reversal (TPR) technical suite intentionally rejects this design pattern.
This technical brief details the structural rationale behind confining the TPR engine strictly to the native chart interval, substantiated by empirical comparative testing. This architecture ensures absolute data consistency, cross-platform synchronization, and real-time responsiveness without the systemic degradation inherent to higher-period lookups.
1. Empirical Case Analysis: Temporal Distortion and Synchronization Latency
To demonstrate the structural failures introduced by cross-period data ingestion, comparative runtime testing was executed on highly liquid derivative data streams. The performance metrics contrast a standard localized lower-period baseline against a simulated higher-period indicators matrix under identical timestamp conditions.
The empirical logs reveal a mathematical divergence in trend recognition and dynamic channel interaction. The visual alignment errors are crystallized through the analysis of corresponding synchronized coordinate pairs.
=== EMPIRICAL TIME-SYNCHRONIZATION LOGS ===
[Coordinate Pair Alpha]
- Localized Micro Execution Point (A1): Signal Triggered via native boundaries crossing.
- Macro-Interval Ingestion Point (A2): Processing delayed, awaiting macro structural finalization.
>> Structural Latency: Significant multi-bar lag observed on the execution chart.

[Coordinate Pair Beta]
- Localized Micro Trend Reversal (B1): Adaptive boundary crossover confirmed instantaneously.
- Macro-Interval Ingestion Point (B2): Trailing cross-period state adjustment delayed by high-period cycle.
>> Operational Consequence: Complete loss of edge during structural transition phases.
Detailed Analysis of Coordinate Pair Alpha (A1 vs. A2)
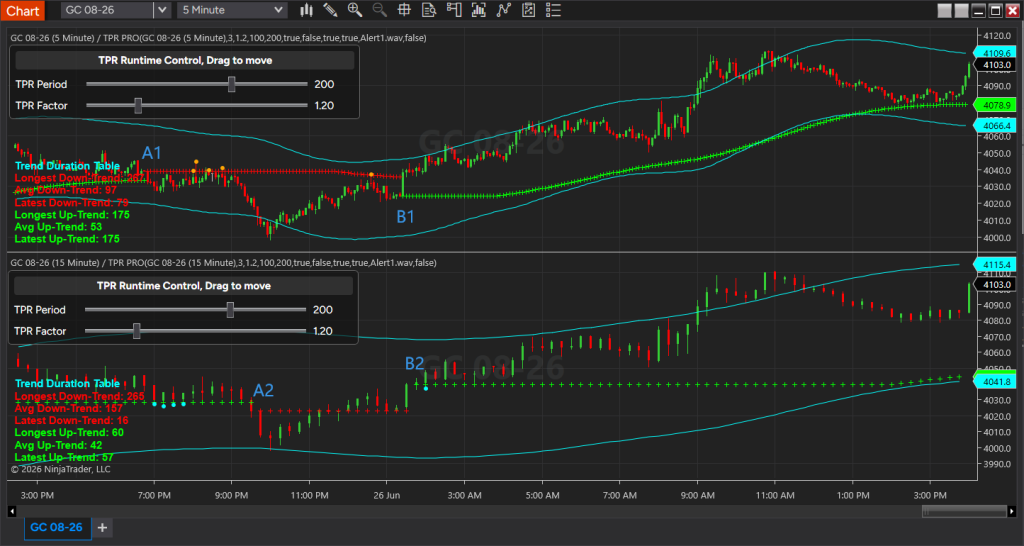
Under intense selling pressure, the localized micro-execution channel hits a breakdown threshold at position A1. At this precise moment, the native chart interval processes the volatility contraction and instantly prints a definitive downward trend state.
Conversely, tracing the exact same time axis to position A2 (the corresponding point calculated via macro-interval ingestion), the system fails to log the trend shift. Because the macro-interval framework requires the completion of its broader time block to solidify its data vector, the trend transformation at A2 lags significantly behind A1. Relying on an MTF architecture would force the execution module to inherit this severe lag, capturing entry fills only after a major portion of the directional expansion has already occurred.
Detailed Analysis of Coordinate Pair Beta (B1 vs. B2)
During a sharp momentum reversal where price structure cycles from a downward phase to an aggressive counter-trend recovery, the localized system prints an upward trend pivot at position B1. The micro-boundary is breached, and the channel adjusts to support mode in real time.
When mapped against the macro-interval tracking stream at position B2, the multi-timeframe proxy exhibits an extensive blocky distortion. The marker at B2 registers the structural transition long after the immediate directional pivot has been established at B1. Consequently, any technical module drawing data from the macro-period stream would execute trades with severe entry slippage, missing the optimal zone of price finalization.
Structural Deductions from Empirical Testing
- Geometric Scaling of Latency: The comparison of (A1, A2) and (B1, B2) proves that cross-period data polling forces a structural delay. When widening the data-ingestion gap further (e.g., polling an hourly cycle from a short-term execution chart), the lag scales exponentially, rendering the signal stream unusable for active trade execution.
- Deformation of Pullback and Reversion Telemetry: The core edge of the TPR mechanism relies on capturing immediate price behavior relative to volatility boundaries. Forcing an MTF data overlay breaks the alignment between microscopic candlestick limits (the raw highs and lows of the execution bar) and the calculated tracking channels, leading to a total failure to catch genuine breakout moments and minor, low-risk entries.
2. Elimination of Look-Ahead Bias and State Repainting
When a quantitative indicator imports an external high-period array onto a low-period chart matrix, it encounters a fundamental flaw in real-time execution: state instability. A macro time block contains multiple micro intervals, meaning the values passed to the execution module remain highly volatile until the macro candle officially closes.
- The Backtesting Deception: Historical strategy testing engines scan finalized databases where macro candles are fully formed and static. This allows the backtester to read closed higher-period values ahead of time, printing an artificially optimized equity curve that cannot be replicated under live market conditions.
- Live Execution Destabilization: In live deployment, the macro-interval tracking channel moves fluidly with every incoming price tick. If an MTF engine modifies its historical tracking array retroactively during an unclosed macro cycle, past signals are continually rewritten. This leads to catastrophic real-time execution errors where entries or stop-outs are triggered based on temporary, ghost markers that disappear upon data finalization.
By binding the TPR framework exclusively to the active chart interval, every single printed marker remains permanently fixed based on closed historical data points unique to that specific timeframe. Repainting is eliminated at the compiler level.
3. Spatial Distortion of Channel-to-Price Microstructure
The mathematical integrity of the system relies on checking how extreme price extensions interact with adaptive volatility boundaries. The relationships tracked by input name 'Potential Rebound Signal' require absolute spatial alignment between raw candlestick extremes and the channel rails.
When an MTF framework is implemented, the macro indicator lines present a segmented, staircase-like profile on lower-period execution screens. This structural deformation ruins the analytical model:
- Boundary Infraction Testing: Precision validation requires the system to measure whether the real-time high or low of a single execution bar has breached the channel limits. A staircase line format introduces artificial price gaps that distort these critical touchpoints.
- Signal Node Displacement: Markers such as the
'Potential bearish Rebound Signal'or'Potential bullish Rebound Signal'are generated by measuring localized price velocity against structural compression zones. Decoupling the calculation timeframe from the chart timeframe warps this spatial geometry, creating a structural blind spot where genuine pullback tests are missed and invalid signals are generated.
4. Cognitive Overload and Multi-Screen Infrastructure
From an execution workflow perspective, overlaying multiple macro tracking metrics onto a singular execution chart introduces severe psychological friction. When an operator identifies a highly optimized, low-risk entry sequence within a localized consolidation zone, visual interference from a macro trend indicator often induces execution paralysis. The trader hesitates due to the perceived resistance of the macro trend, missing the optimal phase of the localized wave.
The TPR system enforces an operational philosophy of “Localized Execution, Logical Closure”:
- Autonomous Workspace Integration: Every chart interval represents a self-contained ecosystem. The operational state of the current cycle, its volatility parameters, and its historical metric duration (as logged on the integrated input name
'Show Trend Duration Table') must be interpreted independently. - Side-by-Side De-escalation: Professional institutional architectures avoid compressing multi-layered time variables onto a single visual workspace. Instead, multi-timeframe analysis is correctly achieved by utilizing independent chart panels arranged side by side across an extended display matrix. This allows macro trend conditions to be monitored cleanly without polluting the micro-execution interface.
5. Cross-Platform Runtime and Efficiency Metrics
From a quantitative engineering standpoint, restricting calculations to the active chart timeframe maximizes operational efficiency across cloud-based environments (such as cloud script servers) and low-latency native trading terminals (such as C++ or C# execution systems).
| Performance Metric | Single-Timeframe TPR Engine | Multi-Timeframe (MTF) Alternatives |
| Computational Complexity | Strictly bounded at $O(N)$ linear complexity; highly optimized for low memory footprints. | Highly irregular scaling; requires heavy historical data matrix allocation and multi-stream alignment arrays. |
| Cross-Platform Parity | Simplified mathematical logic guarantees 100% identical, mirrored signal output across all deployment runtimes. | Variations in how different execution environments index, aggregate, and time-shift high-period data streams lead to widespread signal disparities. |
| Data Ingestion Latency | Instantaneous computation; processing matches real-time server tick updates without intermediate buffering. | Suffers from multi-channel polling latency, introducing execution execution friction during volatile market events. |
Technical Conclusion
The global performance profile of the TPR technical toolset is driven entirely by its deliberate operational focus and structural restraint. Rejecting the development of an MTF configuration is an absolute requirement to preserve the system’s foundational core principles: non-repainting signal execution, exact price-to-channel geometry, and synchronized cross-platform portability.
As proven by the structural lag documented across coordinate blocks (A1, A2) and (B1, B2), real-time edge is generated at the immediate interface of the native chart timeframe—where price action meets uncompromised mathematical precision.