The Trend Pullback Reversal (TPR) indicator is designed to adapt to different trading objectives, ranging from very short-term momentum tracking to medium- and long-term trend analysis. While traders often focus on selecting the appropriate Factor and Period, an equally important parameter is the PullBack Channel Factor.
Many traders assume that the PullBack Channel Factor should remain constant regardless of the TPR settings. The examples below demonstrate why this assumption is incorrect.
Using the same PullBack Channel Factor across different TPR configurations can significantly reduce the usefulness of the PullBack Channel. The channel may become either too narrow, failing to contain normal price fluctuations, or too wide, moving so far away from price that it no longer serves as an effective trading reference.
This article analyzes five real examples to illustrate how the PullBack Channel Factor should be adjusted according to the underlying TPR settings.
Two Different Applications of TPR
Although the PullBack Channel behaves similarly in every market, its optimal setting depends heavily on the purpose of the TPR indicator.
In this comparison, two completely different TPR configurations are used.
Configuration 1 – Ultra Short-Term Trend Tracking
Parameters
- Factor = 0.1
- Period = 15
Timeframe:
- 5-Minute Chart
This configuration is designed for extremely responsive trend analysis.
The indicator reacts quickly to changing market conditions, making it suitable for:
- intraday trading
- rapid momentum shifts
- short-term pullback trading
- early reversal recognition
Since the TPR line itself is already highly responsive, the PullBack Channel must be adjusted differently than it would for slower trend settings.
Configuration 2 – Medium- and Long-Term Trend Tracking
Parameters
- Factor = 2
- Period = 100
Timeframe:
- 300 Tick Chart
This configuration is designed to identify broader market trends while filtering out smaller fluctuations.
Compared with the previous configuration, the trend line is much smoother and changes direction less frequently.
This makes it better suited for:
- larger trend swings
- position management
- trend continuation analysis
- filtering short-term market noise
Because the trend itself is smoother, the PullBack Channel requires a completely different level of sensitivity.
Part 1 – Ultra Short-Term Configuration (Factor = 0.1, Period = 15)
The first three charts use identical TPR settings.
Common Parameters
- Factor = 0.1
- Period = 15
Only the PullBack Channel Factor changes.
| Chart | PullBack Channel Factor |
|---|---|
| A | 40 |
| B | 20 |
| C | 1.5 |
This allows us to isolate the effect of a single parameter.
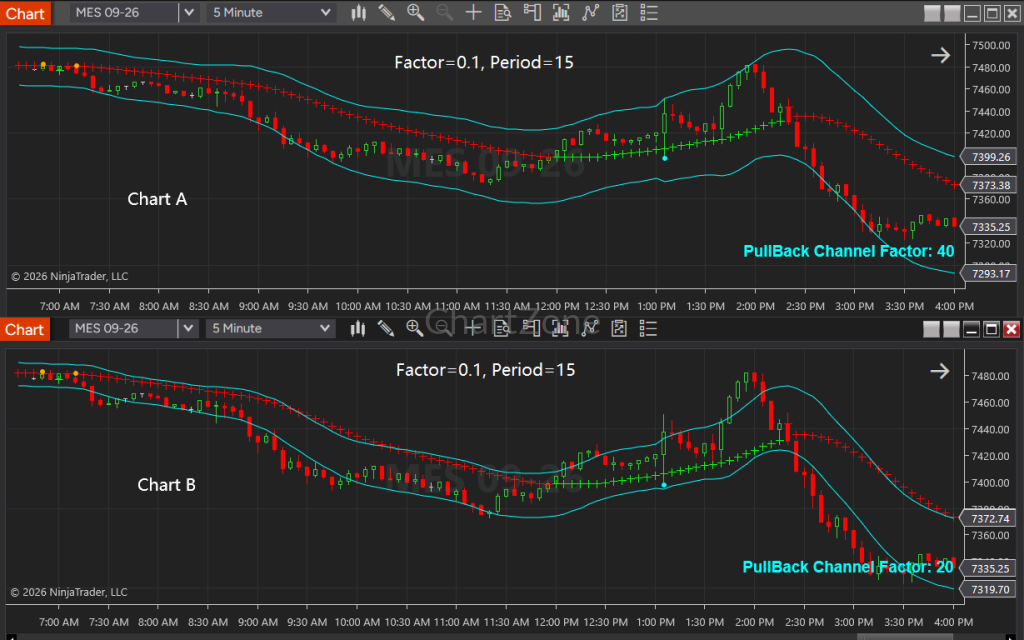
Chart A – PullBack Channel Factor = 40
With a PullBack Channel Factor of 40, the channel provides a wide and smooth envelope around price.
The majority of normal pullbacks remain inside the channel.
Rather than reacting to every individual candle, the channel follows the overall structure of the trend.
This produces several benefits:
- excellent trend visualization
- reduced market noise
- clearly defined pullback areas
- stable dynamic support and resistance
Even during temporary corrections, the channel continues to represent the dominant market structure.
This is exactly the behavior expected from a PullBack Channel.
Chart B – PullBack Channel Factor = 20
Reducing the PullBack Channel Factor from 40 to 20 produces a channel that is more responsive while still maintaining its primary function.
Compared with Chart A:
- the channel narrows,
- price interacts with it more frequently,
- pullbacks become more visible,
- trend structure remains clear.
Many traders may find this configuration to provide an excellent balance between responsiveness and stability.
The channel continues to contain most price movement while providing earlier feedback during corrections.
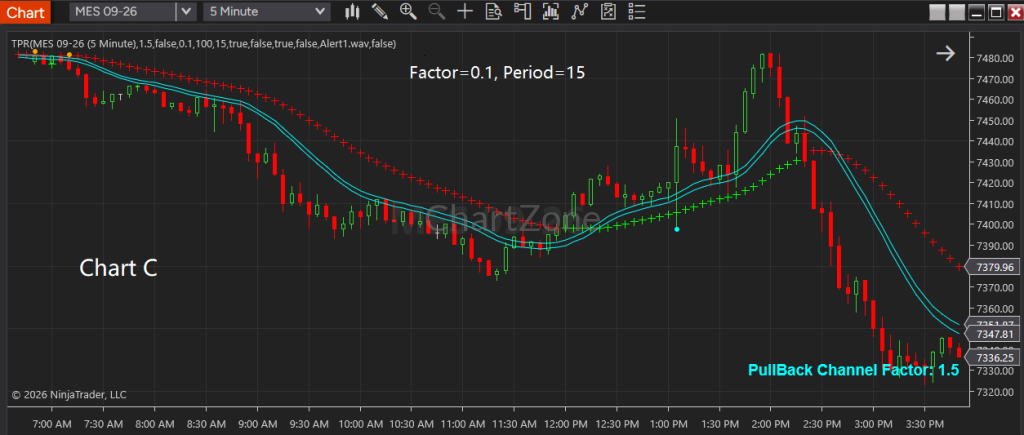
Chart C – PullBack Channel Factor = 1.5
The third chart demonstrates what happens when the PullBack Channel Factor becomes too small for an ultra-fast TPR configuration.
The channel becomes extremely narrow.
Instead of surrounding normal price movement, it closely hugs the trend line.
As a result:
- many candles extend outside the channel,
- ordinary market fluctuations exceed the channel boundaries,
- the channel no longer acts as an effective envelope,
- dynamic support and resistance become less meaningful.
Rather than highlighting pullbacks, the channel simply follows the moving trend line.
Its ability to represent a “channel” is largely lost.
This illustrates an important principle.
When using very fast TPR settings (Factor = 0.1, Period = 15), a relatively large PullBack Channel Factor—typically above 20—is generally required for the PullBack Channel to function as intended.
If the PullBack Channel Factor is reduced below approximately 10, the channel often becomes too narrow to contain normal price action, making it less effective as a visual framework for pullback analysis.
Part 2 – Medium- and Long-Term Configuration (Factor = 2, Period = 100)
The next two charts tell the opposite story.
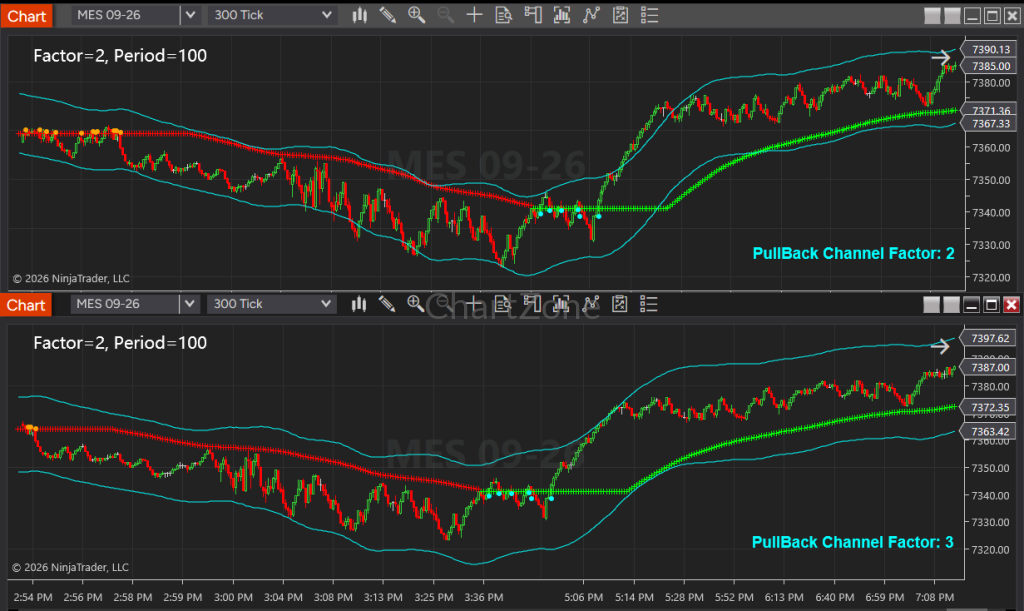
Both charts use identical TPR settings:
- Factor = 2
- Period = 100
Only the PullBack Channel Factor changes.
| Chart | PullBack Channel Factor |
|---|---|
| D | 2 |
| E | 3 |
Chart D – PullBack Channel Factor = 2
With a PullBack Channel Factor of 2, the channel closely follows the slower-moving trend while still enclosing most normal price movement.
Because the underlying trend line changes gradually, a relatively narrow channel is sufficient.
Notice that throughout the sustained rally:
- the channel remains close to price,
- pullbacks stay within the channel,
- support and resistance remain meaningful,
- traders can easily visualize the trend structure.
The PullBack Channel complements the slower TPR trend exceptionally well.
Chart E – PullBack Channel Factor = 3
Increasing the PullBack Channel Factor from 2 to 3 immediately widens the channel.
Although the difference may appear numerically small, the visual impact is significant because the underlying TPR trend is much smoother.
The upper and lower channel boundaries move noticeably farther away from price.
As a result:
- price spends less time interacting with the channel,
- pullback boundaries become less precise,
- the channel contributes less to trade management,
- dynamic support and resistance become less relevant.
The channel still functions correctly, but it begins to lose practical value because it is simply too far away from current market activity.
This demonstrates the opposite principle observed in the 5-minute examples.
When using slower TPR settings (Factor = 2, Period = 100), relatively small PullBack Channel Factor values—typically below 3—allow the channel to remain closely aligned with price and provide meaningful pullback guidance.
As the PullBack Channel Factor increases, the channel widens disproportionately, reducing its usefulness for identifying active pullback zones.
Why the Optimal PullBack Channel Factor Changes
At first glance, it may seem logical to use the same PullBack Channel Factor across all TPR settings. However, the examples above demonstrate why this approach is ineffective.
The PullBack Channel is built around the behavior of the underlying TPR trend line. When the TPR trend is highly responsive, it follows price closely and changes direction more frequently. In this case, the channel must be wider to accommodate the normal volatility around such a fast-moving trend.
Conversely, when the TPR trend is smoother and designed to track broader market swings, it naturally filters out much of the short-term noise. A wide channel becomes unnecessary because the trend line itself already provides substantial smoothing. Using a smaller PullBack Channel Factor keeps the channel close to price, allowing it to serve as an effective framework for pullback analysis.
In other words, the PullBack Channel Factor should not be viewed as an isolated setting. It should always be selected in the context of the TPR Factor and Period, as these parameters determine the responsiveness of the underlying trend.
Practical Guidelines
Based on the examples above, the following guidelines provide a practical starting point:
| TPR Configuration | Typical Purpose | Recommended PullBack Channel Factor |
|---|---|---|
| Factor = 0.1, Period = 15 | Ultra short-term trend tracking | 20–40 or higher |
| Factor = 2, Period = 100 | Medium- and long-term trend tracking | 1–3 |
These values are not fixed rules, as different markets and instruments exhibit different levels of volatility. However, they illustrate an important principle:
The faster the underlying TPR trend, the larger the PullBack Channel Factor generally needs to be. The slower and smoother the TPR trend, the smaller the PullBack Channel Factor should be.
Conclusion
The PullBack Channel is most effective when its width is matched to the responsiveness of the underlying TPR trend.
For ultra short-term TPR settings such as Factor = 0.1 and Period = 15, the trend reacts quickly to market changes. A larger PullBack Channel Factor (typically above 20) provides a channel wide enough to contain normal price fluctuations, allowing traders to identify meaningful pullbacks without being distracted by minor volatility. If the PullBack Channel Factor is reduced below 10, the channel often becomes so narrow that candles frequently extend beyond its boundaries, diminishing its value as a true channel.
For medium- and long-term TPR settings such as Factor = 2 and Period = 100, the situation is reversed. The trend line is inherently smoother, so a smaller PullBack Channel Factor (typically below 3) keeps the channel aligned with price and preserves its role as dynamic support and resistance. Increasing the factor too much causes the channel to drift too far from price, making pullback analysis less precise and less actionable.
Ultimately, there is no universal PullBack Channel Factor that works across all TPR configurations. The most effective setting is one that complements the responsiveness of the underlying trend. When the PullBack Channel Factor is properly matched to the TPR Factor and Period, the channel becomes a powerful visual tool for identifying pullbacks, evaluating trend quality, and maintaining a consistent framework for trade analysis across different market conditions.