

Description
One Indicator. Three Insights. Trend | Pullback | Reversal.
A professional trend analysis indicator that helps traders distinguish between trend continuation, pullbacks, and potential reversals while filtering out much of the market noise. Whether you trade intraday index futures, forex, or digital assets, TPR provides a clean, institutional-grade visual layout to keep you on the right side of the primary trend.
New to TPR? Get started with our Introduction to the Trend Pullback Reversal (TPR) Indicator and discover how it transforms your chart analysis.
Why Choose TPR?
TPR = Indicator + Method + Community + Ecosystem
TPR is more than a technical indicator. It is a complete trading methodology designed to help traders identify Trend, Pullback, and Reversal conditions across different markets, timeframes, and chart types within a unified framework.
Combined with the ChartZone.net community, it creates a continuous cycle of use, feedback, learning, and evolution. **TPR provides the analytical framework. ChartZone provides the environment where that knowledge can be shared, tested, and expanded.**Core System Architecture & Features
1. Dynamic Trend Tracking Engine
TPR plots an adaptive structural boundary directly on the price chart, functioning as dynamic support and resistance.
- Macro Trend Identification: Highlights macro buying dominance and establishes a trailing support structure.
- Institutional Distribution Detection: Isolates distribution zones and provides dynamic resistance boundaries.
- Adaptive Boundary: The main TPR line acts as dynamic support in uptrends and resistance in downtrends.
- Visual Confirmation: Real-time color changes provide clear visual confirmation of trend shifts.
Deep Dive Guides:
- See how settings affect behavior in The impact of different Factor and Period inputs on the TPR indicator.
2. Volatility Envelope & Outlier Detection
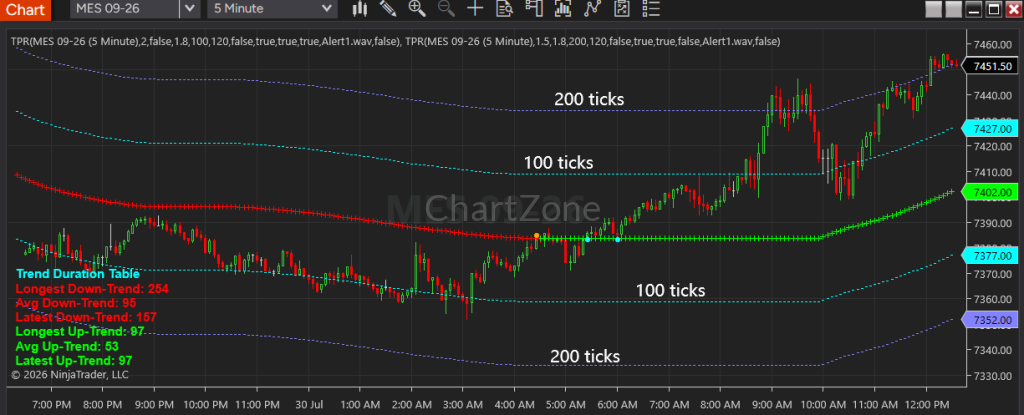
An optional expanded trailing zone provides a quantified statistical band for volatility expansion.
- Extreme Volatility Identification: When trend lines breach this dynamic boundary, the system identifies overextended market states.
- Mean Reversion & Shift Preparation: Warns of impending structural exhaustion before a sharp pullback or primary trend reversal occurs.
Deep Dive Guides:
- Understand the structural differences in Trailing Band vs. PullBack Channel (also available as PullBack Channel vs. Trailing Band).
- Master volatility-based strategy in How Trailing Band Width Changes the Behavior of TPR: Building Dynamic Profit Targets, Trailing Stops, and Support & Resistance.
3. Early Warning Structural Reversal Signals
- Reversal Signal Dots: High-precision visual markers (orange/cyan) identify potential structural points where a change in direction may be developing.
- Noise Reduction Filtering: Signals are generated only when price action interacts with dynamic volatility thresholds, eliminating false chop during low-liquidity regimes.
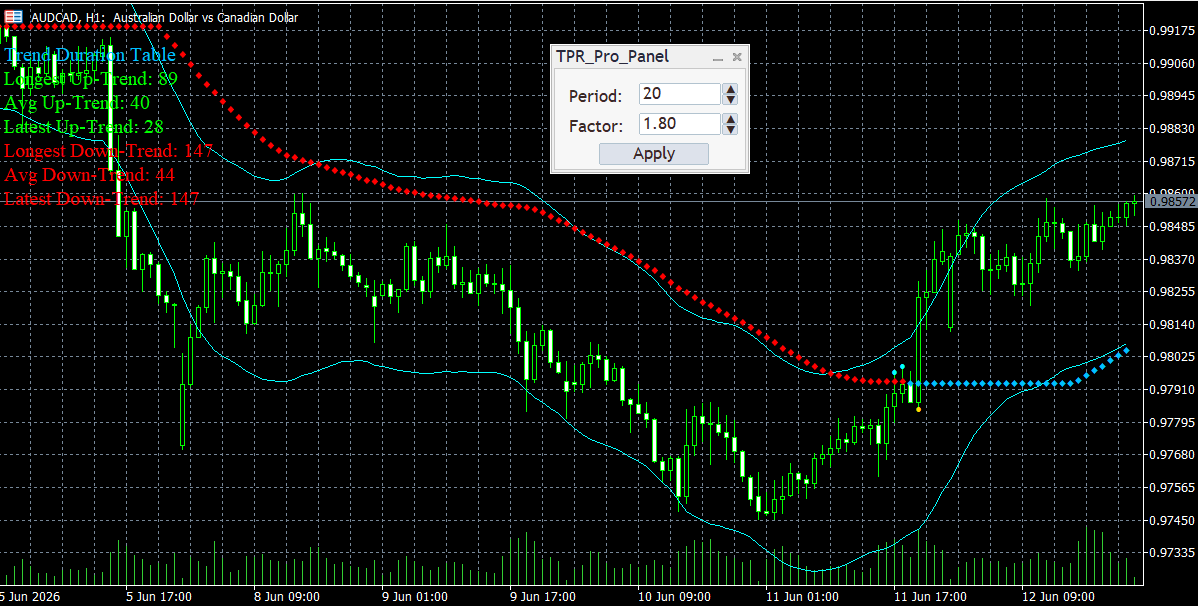
4. Real-Time Quantitative Trend Statistics (Trend Duration Table)
TPR includes an embedded real-time statistical engine that tracks trend duration directly on your chart:
- Historical Extremes: Monitors maximum bar persistence for both uptrends and downtrends across the current chart session.
- Statistical Averages: Calculates mean trend length to establish a baseline for expected market moves.
- Exhaustion Metrics: Compares current active trend duration against historical averages, alerting traders when a trend is mathematically overextended and prone to a mean-reversion pullback.
- Learn the core mechanics in Trend analysis with Trend Pullback Reversal TPR indicator.
5. The TPR PRO Runtime Control is an interactive, on-chart user interface feature designed to enhance real-time technical analysis and strategy calibration.
TPR PRO only — Runtime Control is not available in the standard TPR version.
Key Capabilities & Solution Value
- Real-Time On-Chart Parameter AdjustmentIt eliminates the need to manually open indicator property windows to adjust core sensitivity settings. Traders can dynamically modify core calculation parameters directly on the active chart using interactive sliders and step buttons.
- Instant Historical Recalculation & Visual FeedbackWhen parameters are altered via the interface, the system dynamically updates all indicator plots, channel lines, and trend duration analytics across historical bars in real time, allowing immediate visual backtesting of different market sensitivities.
- Movable & Non-Intrusive Control PanelThe interface features a draggable header bar, allowing traders to position the control panel anywhere on the chart canvas to prevent obscuring critical price action or existing visual signals.
- Precision Fine-TuningIn addition to slider-based sweeping, the control panel includes dedicated increment and decrement step buttons (
+/-) for exact parameter fine-tuning. - Customizable VisibilityThe entire runtime control interface can be completely enabled or hidden through the indicator configuration properties, maintaining a clean visual workspace when live parameter testing is not required.
Strategic Trading Approaches
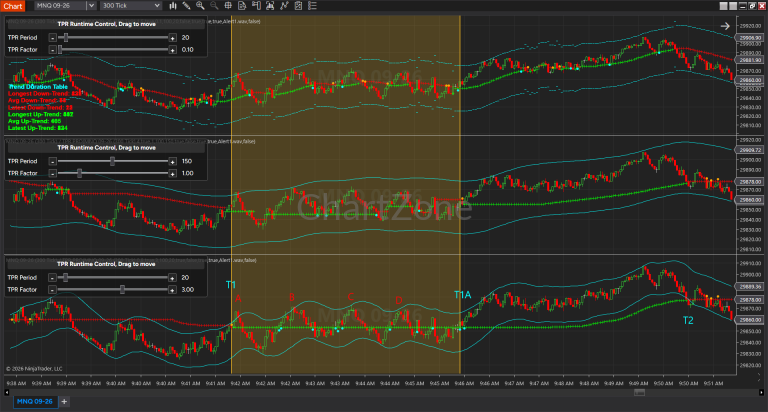
Multi-Parameter / Multi-Timeframe Approach
Apply two instances of TPR on the same chart:
- Main chart: Shorter-term settings (more sensitive) for precise entries and exits.
- Sub-chart: Longer-term settings for overall trend direction.
Crucial Rule: Strongest signals occur when both short-term and long-term TPR lines are the same color (both green or both red). When they diverge, treat short-term signals with caution—they often represent temporary counter-moves or traps within the dominant trend.
Strategic Application Guides:
- Eliminate Lag: Read our architectural whitepaper on Why TPR Doesn’t Use MTF (No Structural Lag) to understand how we resolve multi-timeframe insights without traditional indicators’ lagging side-effects.
- See it in action: Check out An example of Multi-Timeframe Technical Analysis by TPR.
- Synthesize perspectives with Multi-Parameter TPR Analysis: Understanding Trend Development Through Multiple Perspectives.
- Maximize trading results using How to Use the TPR Indicator More Effectively.
Pullback Channel Customization & Optimization
Enhance your trend entry precision with fine-tuned Pullback Channel behaviors:
- Pullback Setup Guide: How to Use the TPR PullBack Channel Feature.
- Optimization Framework: Optimizing the PullBack Channel Factor: How It Should Change with TPR Trend Settings.
Works Across Markets & Platforms
TPR is highly versatile and fits directly into your existing setup:
- Supported Assets: ✓ Stocks ✓ Futures ✓ Forex ✓ Crypto ✓ Indices ✓ CFDs
- Compatible Charts: Works on all timeframes and most standard price-based chart types (including Candlestick, OHLC Bar, Line Break, Heikin Ashi, Renko, and Range Bars).
Resource Center & Support
Have questions? Check the FAQ tab or contact us—we’re happy to help.
Note: Unless otherwise specified, TPR functions identically across all platforms, and there should be no material difference in the plots and drawing objects shown in the screenshots. If screenshots for your specific platform are limited, you may refer to those from any platform, as they are essentially identical.
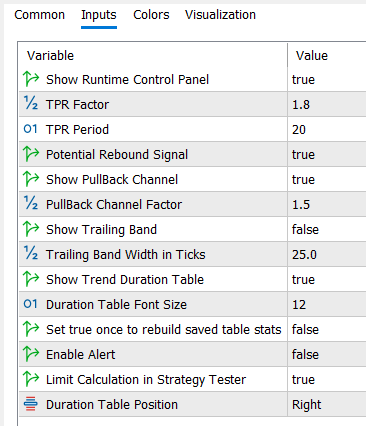
Advanced Performance Settings (MT5 exclusive input)
(Limit Calculation in Strategy Tester)
Designed to maximize your backtesting speed and efficiency. When enabled, the indicator optimizes performance by running calculations only from the exact start date of your strategy test. By smartly ignoring the unnecessary historical data loaded prior to your test window, it significantly reduces CPU strain and loading times, allowing you to iterate and run backtests much faster.
(Set true once to rebuild saved table stats)
A manual override tool for your trend statistics. To keep your charts running seamlessly, the indicator intelligently saves your table data to your platform’s permanent memory—ensuring your stats survive terminal restarts and chart reloads without needing to recalculate thousands of historical bars every time.
If you ever want to wipe this historical memory and force the indicator to rebuild your table statistics from a completely clean slate on your current chart, you can use this input as a manual reset button.
How to use it:
- Immediately reopen the settings, change it back to False, and click OK.This performs a one-time purge of the saved data, giving you a fresh start.
- Open your indicator settings, change this input to True, and click OK.





Reviews
There are no reviews yet.