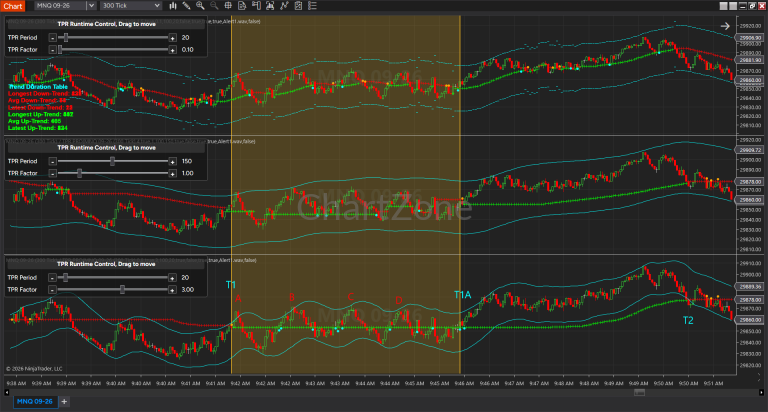
The following examples demonstrate one of the most effective ways to use the Trend Pullback Reversal (TPR) indicator: applying three different parameter sets simultaneously on the same chart. Instead of relying on a single trend definition, traders can observe how trends evolve across different sensitivity levels, allowing them to distinguish between short-term market noise and higher-quality trend reversals.
The three TPR settings used in these examples are:
| TPR Setting | Period | Factor | Sensitivity | Purpose |
|---|---|---|---|---|
| Short-Term TPR | 20 | 0.1 | Highest | Detects the earliest trend changes and pullbacks |
| Medium-Term TPR | 150 | 1 | High | Defines the primary market trend |
| Low-Sensitivity TPR | 20 | 3 | Low | Filters noise and confirms stronger directional moves |
Although all three indicators are applied to the same 300 Tick chart, each responds differently because of its parameter configuration. Their interaction provides considerably more information than any single TPR alone.
Why Use Three Different TPR Settings?
Every trend develops in stages.
A very sensitive indicator detects changes almost immediately but is also more susceptible to temporary fluctuations.
A less sensitive indicator reacts later but provides much stronger confirmation that the market has truly changed direction.
Using multiple TPR settings allows traders to observe how a new trend propagates from fast signals to slower confirmations.
Instead of asking:
“Is this an uptrend?”
you begin asking:
“How mature is this trend?”
This distinction is extremely valuable for trade timing.
Understanding the Three TPR Layers
1. Short-Term TPR (Period 20, Factor 0.1)
This is the fastest TPR configuration.
Characteristics:
- Detects reversals almost immediately
- Shows every meaningful pullback
- Excellent for early entries
- Generates the largest number of trend changes
- Most responsive to short-term momentum
It answers:
What is happening right now?
2. Medium-Term TPR (Period 150, Factor 1)
This TPR represents the dominant market direction.
Characteristics:
- Much smoother trend structure
- Filters many temporary reversals
- Defines the primary trend
- Excellent for directional bias
It answers:
What is the market’s main trend?
3. Low-Sensitivity TPR (Period 20, Factor 3)
Increasing the Factor dramatically reduces sensitivity.
Characteristics:
- Ignores minor pullbacks
- Highlights only stronger directional changes
- Produces cleaner trend swings
- Excellent for identifying major momentum shifts
It answers:
Has the market moved far enough to justify a true trend reversal?
The Importance of the Yellow Highlighted Areas
The yellow shaded regions are perhaps the most informative parts of these examples.
These are disagreement zones, where the three TPR settings do not yet agree on market direction.
Instead of viewing these areas as confusion, they should be interpreted as transition periods.
This is where the market is deciding whether the move is:
- merely a pullback,
- a short-term reversal,
- or the beginning of an entirely new trend.
The progression from T1 to T1A is an excellent illustration of this concept.
Phase 1 — T1 to T1A
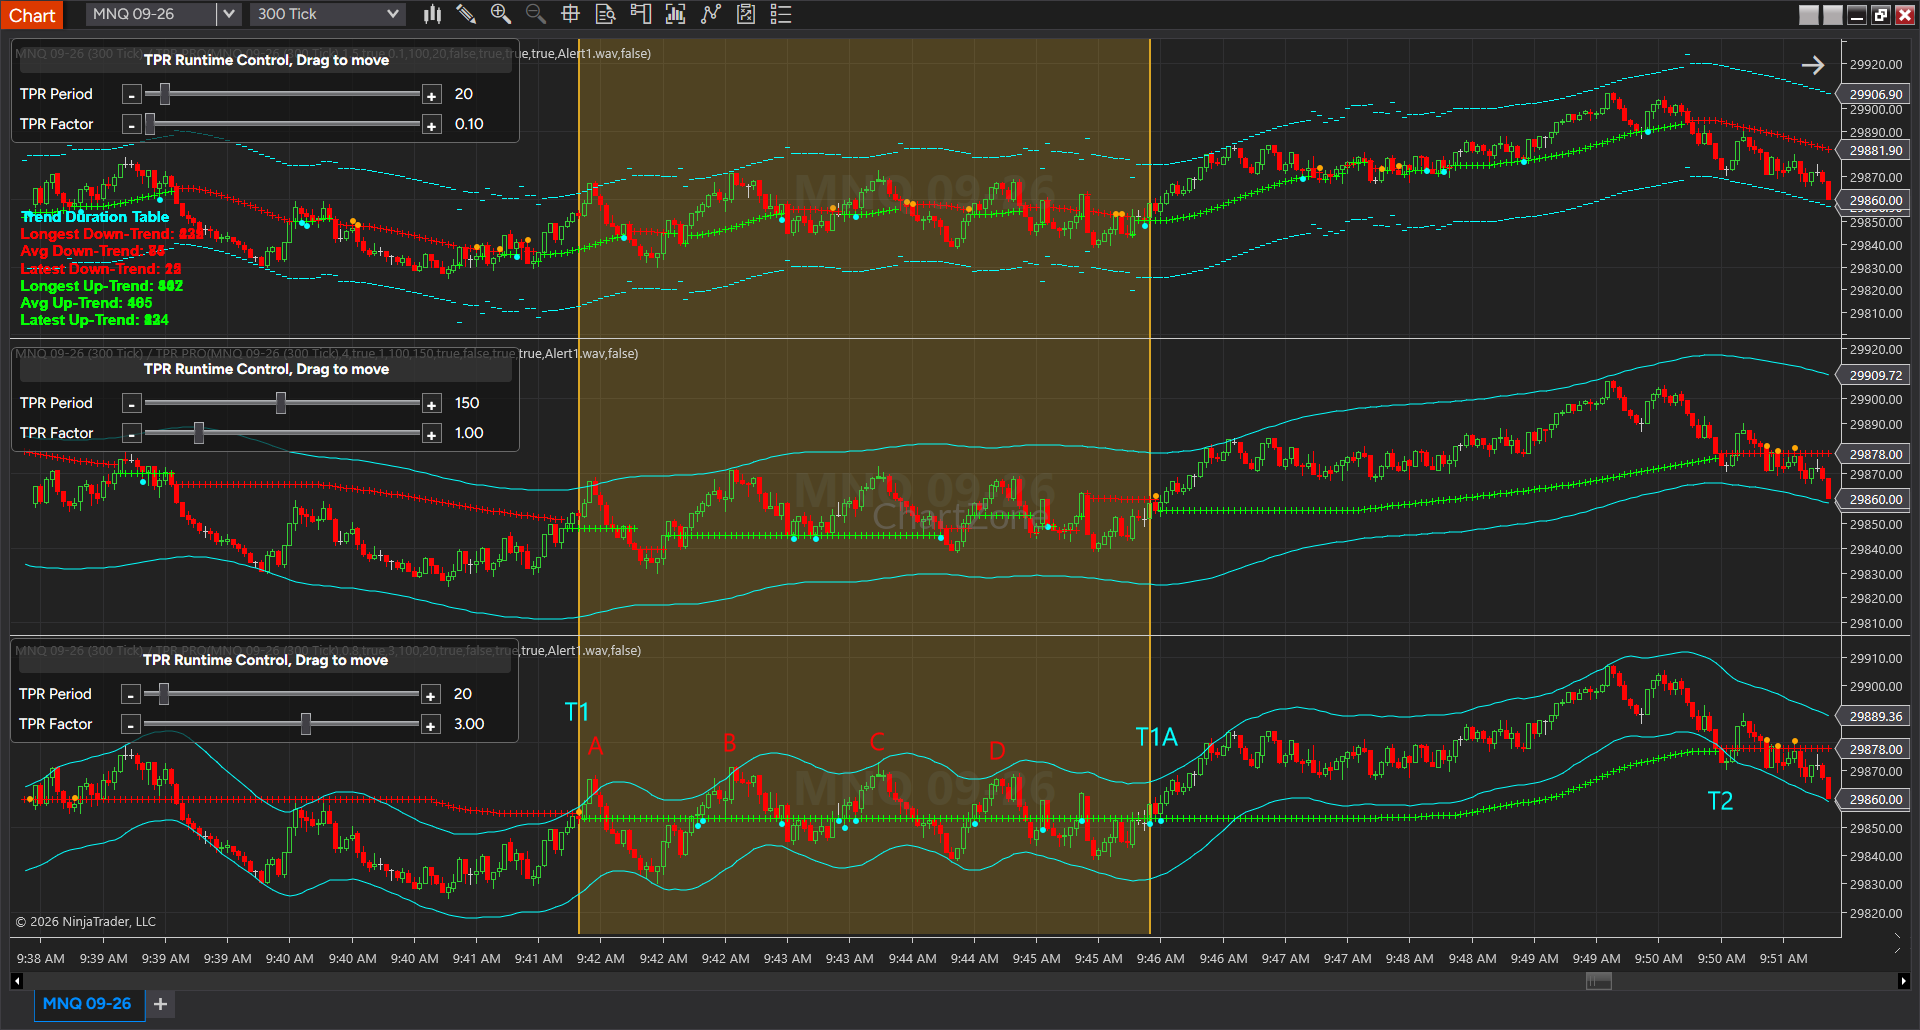
At T1, the most sensitive TPR immediately turns bullish.
The medium and low-sensitivity TPRs, however, remain bearish.
This creates the first disagreement zone.
At this stage:
- aggressive traders may already recognize improving momentum,
- conservative traders still consider the market bearish.
Price begins making higher highs and higher lows, but confirmation has not yet spread across all TPR settings.
Eventually, at T1A, the low-sensitivity TPR also turns bullish.
Now all three TPR configurations agree.
This progression demonstrates how a new trend develops:
Short-Term TPR → Medium-Term TPR → Low-Sensitivity TPR
Each confirmation reduces uncertainty.
Phase 2 — T2
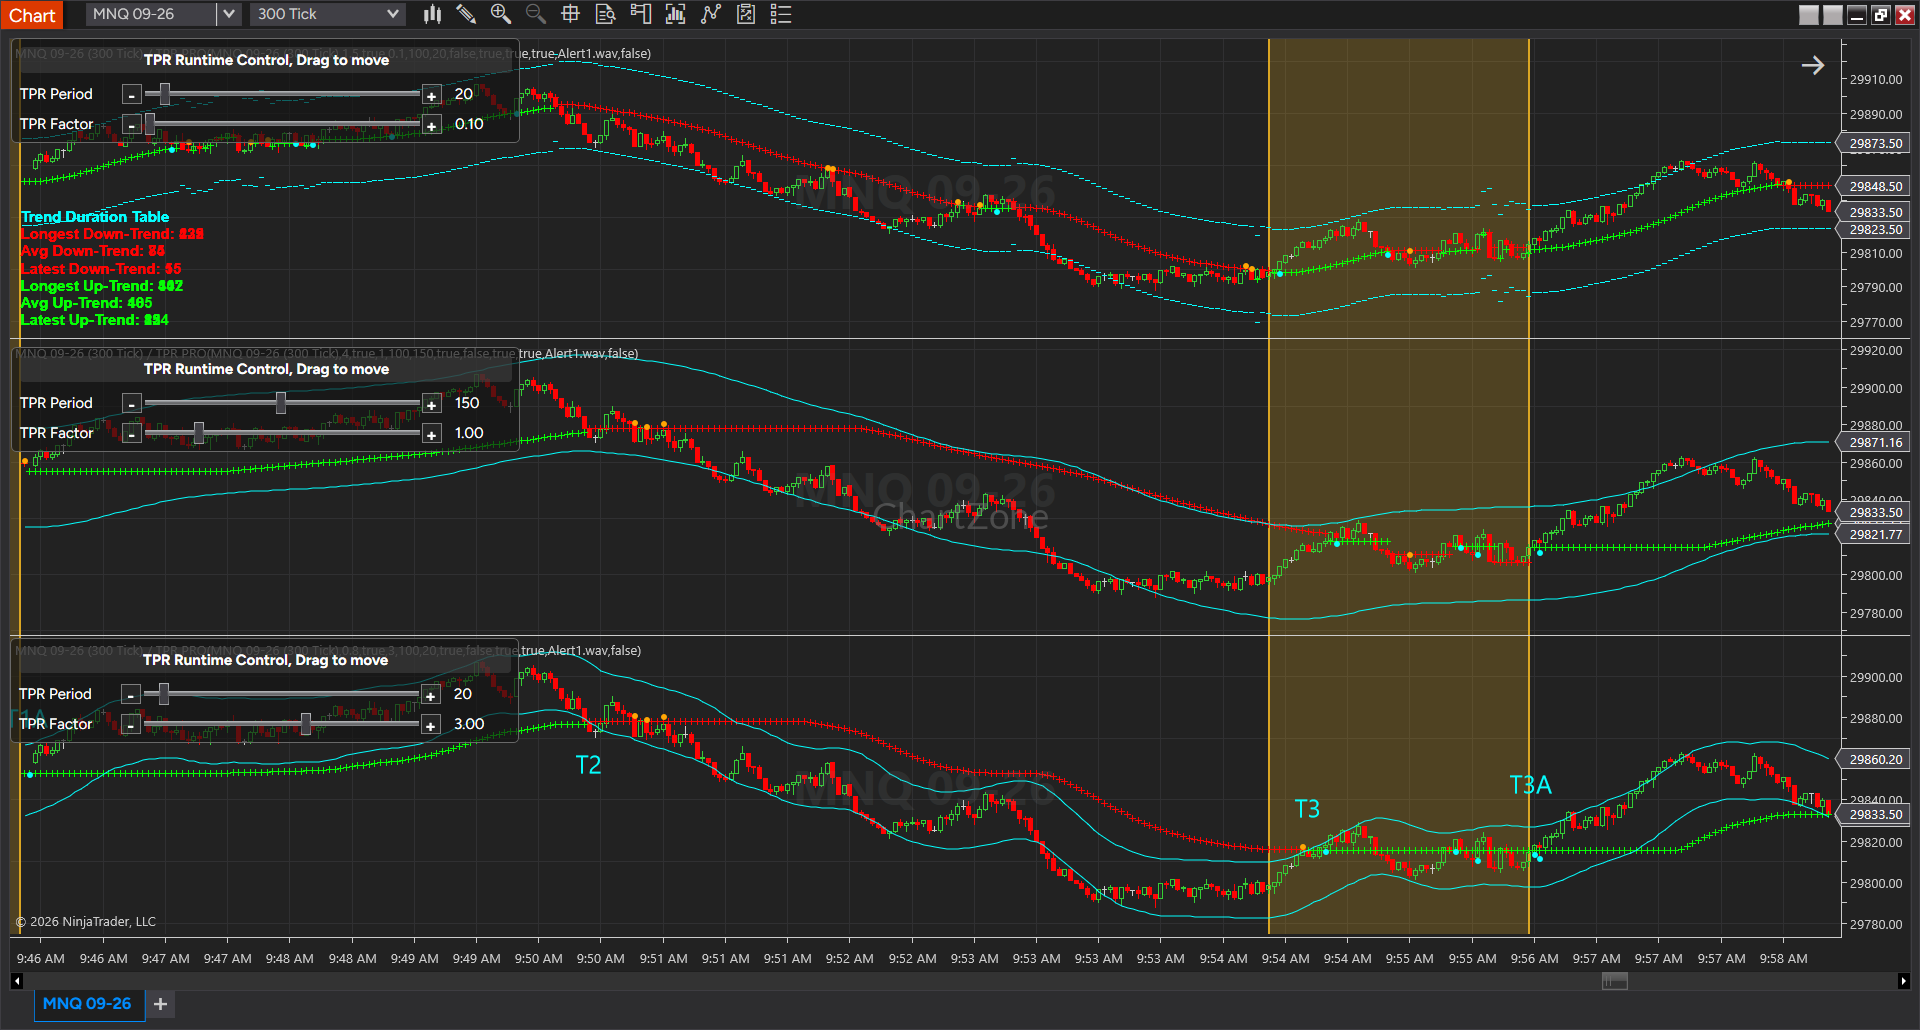
After the bullish trend matures, the fast TPR begins reacting to weakening momentum.
Notice that the short-term TPR changes direction much earlier than the slower configurations.
This serves as an early warning that bullish momentum is fading.
The medium-term trend remains intact, indicating that the move is more likely a pullback than a complete reversal.
This is an excellent example of using TPR to distinguish between:
- temporary weakness
- structural trend change
Phase 3 — T3 and T3A
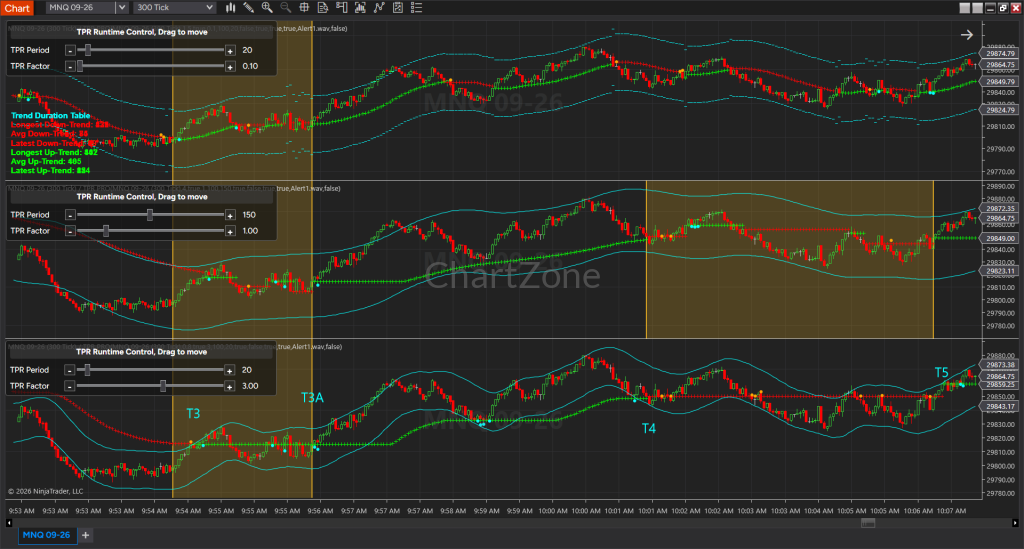
Another excellent disagreement sequence appears.
At T3, the short-term TPR identifies improving buying pressure.
Price begins recovering.
However:
- Medium-Term TPR remains bearish.
- Low-Sensitivity TPR also remains bearish.
This indicates that buyers have appeared, but the larger market has not yet confirmed a new trend.
As buying pressure continues, T3A occurs.
The low-sensitivity TPR finally changes direction.
This transition confirms that buyers have gained sufficient control to reverse the larger trend.
The disagreement zone successfully filtered premature bullish signals while still allowing traders to observe the transition in real time.
Phase 4 — T4
Following the rally, the market begins weakening again.
The short-term TPR reacts first.
This is another example where the fast configuration provides advance notice of a possible trend deterioration.
The medium and slower TPRs delay their confirmation until price proves the move has enough strength.
This prevents overreacting to every small retracement.
Phase 5 — T5
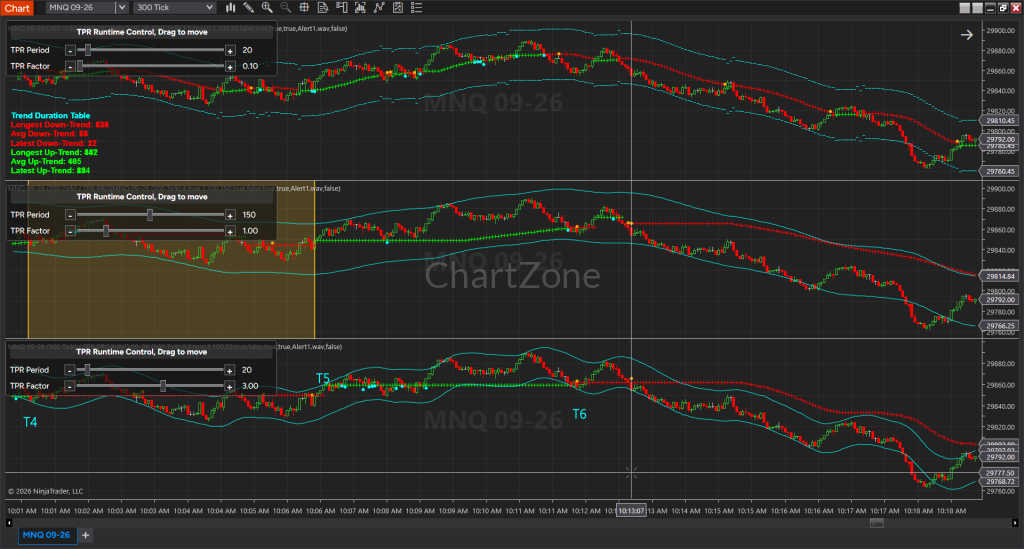
At T5, all three indicators gradually align again as bullish momentum strengthens.
Notice how the lower sensitivity TPR remains stable throughout many small fluctuations.
This stability helps traders remain in profitable trades rather than exiting during every minor correction.
Phase 6 — T6
T6 demonstrates a mature bearish trend.
All three TPR settings eventually align in the same direction.
Once agreement occurs:
- trend confidence increases,
- pullbacks become easier to identify,
- traders can focus on continuation opportunities rather than attempting premature reversals.
This alignment often represents the highest-probability trading environment because all three perspectives describe the same market structure.
How to Use TPR for Market Analysis
Rather than using TPR solely as a buy/sell signal, it is more effective to treat it as a market structure analysis tool.
Step 1 — Determine the Longer-Term Bias
Begin with the medium-term TPR.
Ask:
- Is it bullish?
- Is it bearish?
- Is it flat?
This establishes the primary trading direction.
Step 2 — Observe the Fast TPR
The short-term TPR provides information about immediate momentum.
If it moves against the medium trend:
- expect a pullback,
- not necessarily a reversal.
If it moves back in the direction of the medium trend:
- continuation becomes increasingly likely.
Step 3 — Wait for Agreement
The highest-quality trends occur when:
- Short-Term TPR
- Medium-Term TPR
- Low-Sensitivity TPR
all point in the same direction.
This alignment indicates that momentum has expanded across multiple time horizons rather than existing only as a short-term fluctuation.
Step 4 — Study the Disagreement Zones
The yellow highlighted areas are often where the best market information exists.
Instead of asking:
“Should I trade now?”
ask:
- Which TPR changed first?
- Which one has not confirmed?
- Is momentum expanding or weakening?
- Is this a pullback or a genuine trend reversal?
These questions provide significantly more insight than relying on a single indicator crossover.
Advantages of Using Multiple TPR Configurations
Running three TPR settings on the same chart offers several important advantages:
- Earlier Detection: The high-sensitivity TPR identifies emerging momentum before the larger trend changes.
- Trend Confirmation: The medium-term TPR confirms whether the move is developing into a sustainable trend.
- Noise Reduction: The low-sensitivity TPR filters out many false reversals and insignificant pullbacks.
- Trend Maturity Assessment: Traders can estimate whether a trend is just beginning, strengthening, or nearing exhaustion based on the degree of agreement among the three TPRs.
- Objective Transition Analysis: Disagreement zones reveal the evolution of trend transitions instead of forcing an immediate bullish or bearish interpretation.
- Improved Trade Management: Fast TPRs help optimize entries, while slower TPRs help traders stay with larger trends and avoid exiting on routine pullbacks.
Conclusion
These four examples illustrate that TPR is far more than a conventional trend-following indicator. By combining three parameter sets with different sensitivity levels, traders gain a layered view of market behavior that captures the full lifecycle of a trend—from its earliest momentum shift, through confirmation, to mature continuation and eventual exhaustion.
The sequence from T1 through T6 demonstrates a recurring principle: new trends almost always emerge first in the most sensitive TPR, then propagate to the medium-term TPR, and finally receive confirmation from the low-sensitivity TPR. The yellow disagreement zones mark this transition process, providing valuable insight into whether the market is experiencing a temporary pullback or a genuine structural reversal.
Rather than treating TPR as a simple signal generator, traders can use it as a comprehensive market analysis framework. By monitoring how different TPR settings interact, they gain a clearer understanding of trend strength, market consensus, and the progression of momentum across multiple sensitivity levels—leading to more informed entries, greater confidence in holding winning positions, and better management of trend transitions.