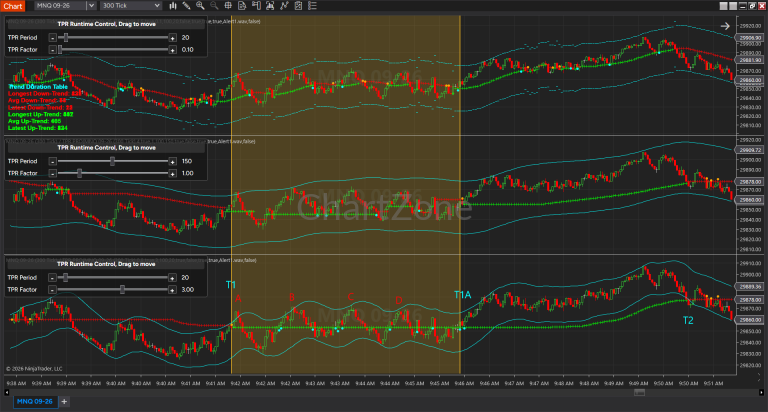
Comparing Two Dynamic Boundary Methods Across Different Chart Types
The Trend Pullback Reversal (TPR) indicator provides multiple ways to visualize market structure around the TPR Trend Line. Two of its most widely used features are Trailing Band and PullBack Channel. Although both create upper and lower boundaries around the same Trend Line, they are based on different calculation methods and are designed for different trading objectives.
This article compares both features using the same TPR Trend Line settings on two different chart types. The only difference is how the boundaries are calculated.
Rather than asking which one is better, the more useful question is:
Which one better suits your trading style and analytical objective?
TPR PRO Runtime Control
The charts shown in this article were generated using TPR PRO, which includes the Runtime Control panel.
Runtime Control allows traders to adjust the two most important TPR parameters directly from the chart:
- TPR Period
- TPR Factor
This makes it possible to instantly evaluate different Trend Line sensitivities without reopening the indicator settings or reloading the chart.
Note: Runtime Control is available exclusively in TPR PRO. The standard version uses fixed parameters configured through the indicator settings.
15-Minute Chart Comparison
Long-Term, Low-Sensitivity Trend Tracking
TPR Parameters
- Period = 200
- Factor = 3.0
This parameter combination is designed for long-term trend analysis.
A larger Factor makes the TPR Trend Line less sensitive to short-term price fluctuations, allowing it to focus on the primary market trend while filtering out smaller pullbacks and market noise.
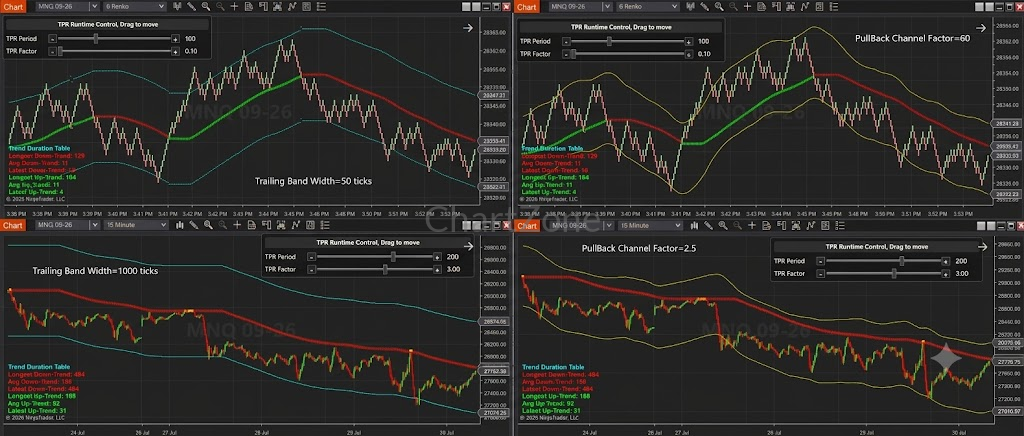
Both charts below use exactly the same Trend Line. The only difference is the boundary calculation method.
- Chart 1: Trailing Band (Width = 1000 ticks)
- Chart 2: PullBack Channel (Factor = 2.5)
What Immediately Stands Out
The first observation is that the red TPR Trend Line is identical in both charts. This is expected because the Period and Factor are unchanged.
The difference lies entirely in how the upper and lower boundaries are constructed.
Trailing Band
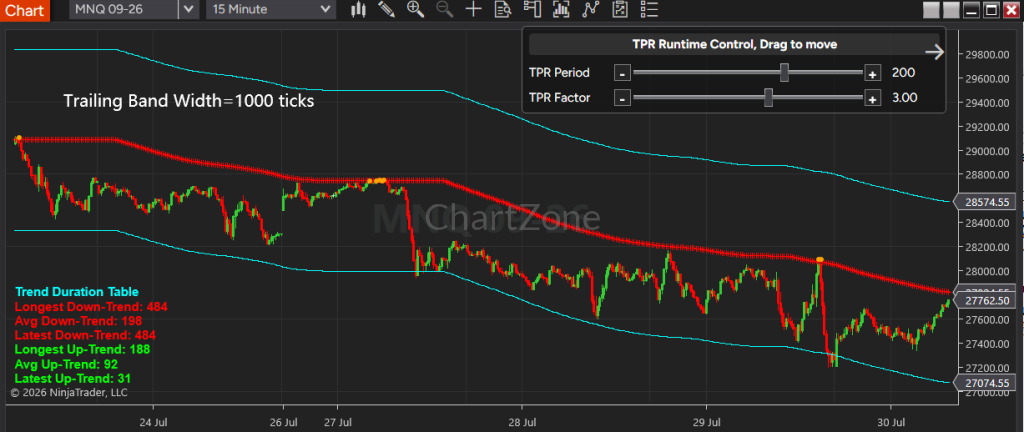
The Trailing Band maintains a constant distance from the Trend Line throughout the entire downtrend.
Notice that:
- The upper and lower bands remain perfectly parallel to the Trend Line.
- The spacing never changes, regardless of market volatility.
- Large price swings do not affect the band width.
This creates a clean and consistent envelope around the Trend Line, making it ideal for measuring fixed trading distances.
PullBack Channel
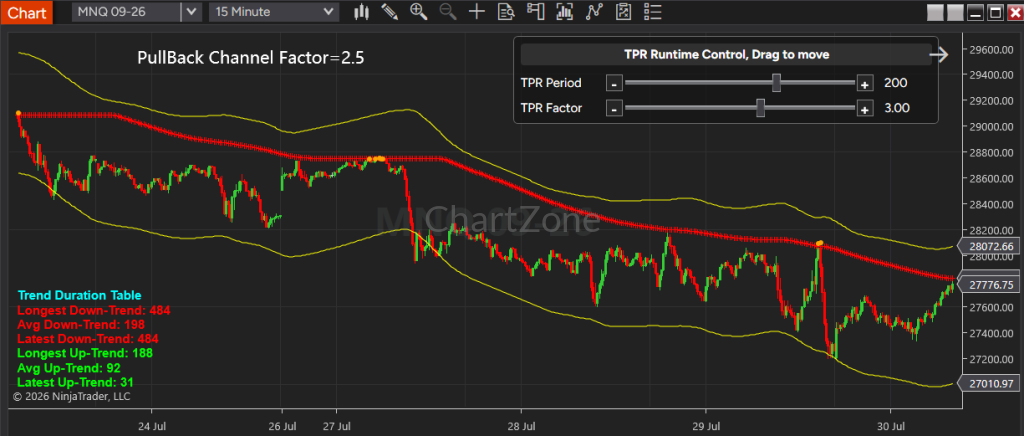
The PullBack Channel behaves very differently.
Instead of remaining parallel, the yellow channel continuously adjusts according to the relationship between recent candles and the Trend Line.
As price expands away from the Trend Line, the channel naturally widens.
As price begins clustering closer to the Trend Line, the channel contracts.
The result is a boundary that reflects the actual distribution of price rather than maintaining a predefined distance.
Key Observation
On a long-term trend chart, the difference is immediately visible.
Trailing Band measures a fixed distance from the Trend Line.
PullBack Channel measures how price is distributed around the Trend Line.
Although both surround the same Trend Line, they represent two completely different analytical concepts.
6 Renko Chart Comparison
Medium-Term, High-Sensitivity Trend Tracking
TPR Parameters
- Period = 100
- Factor = 0.1
This configuration is designed for medium-term trend tracking on Renko charts.
Because the Factor is much smaller, the Trend Line reacts much faster to changes in price direction.
The higher sensitivity makes short-term trend changes easier to observe while still filtering random market noise.
Again, both charts use identical Trend Line parameters.
Only the boundary calculation changes.
- Chart 1: Trailing Band (Width = 50 ticks)
- Chart 2: PullBack Channel (Factor = 60)
Comparing the Two Approaches
The Renko charts make the differences between the two boundary methods even more apparent.
Trailing Band
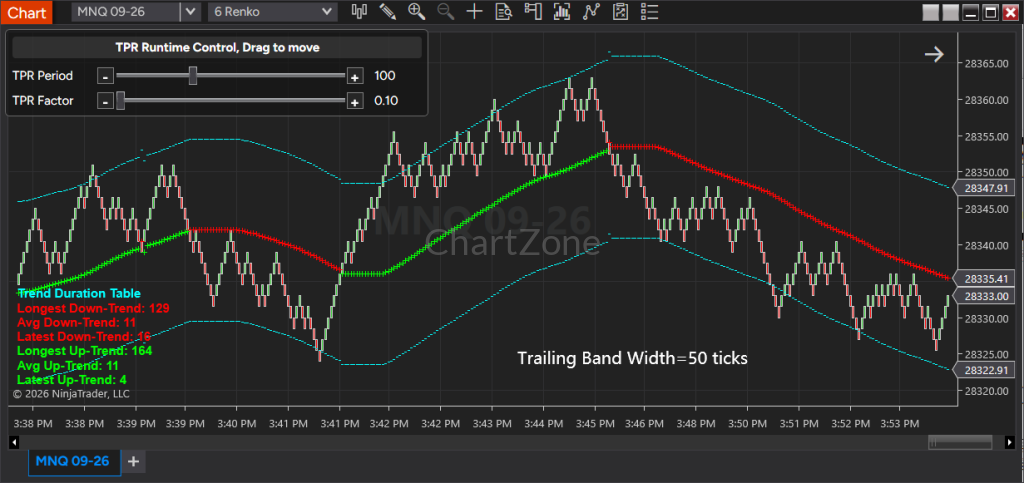
Despite the Trend Line reacting much more quickly than in the 15-minute example, the cyan Trailing Band continues to maintain a perfectly constant offset from the Trend Line.
Whether the market accelerates or consolidates, the band width remains unchanged.
This demonstrates that the Trailing Band is completely independent of candle distribution.
PullBack Channel
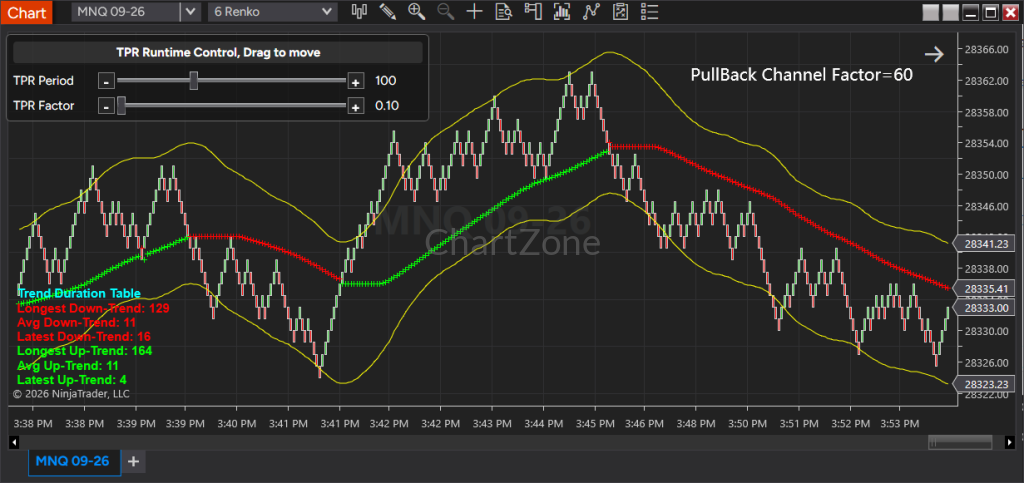
The PullBack Channel continues adapting to market behavior.
As Renko bricks become more compressed during consolidations, the channel narrows.
As directional movement becomes stronger, the channel expands to reflect the larger distance between price and the Trend Line.
Because Renko charts remove much of the time-based market noise, the adaptive behavior of the PullBack Channel becomes even easier to recognize.
Key Observation
Although the Trend Line is significantly more responsive on the Renko chart, the underlying behavior of both boundary methods remains unchanged.
The Trailing Band always maintains a constant offset, while the PullBack Channel continuously adapts to changing price distribution.
This consistency demonstrates that the difference between the two methods is independent of chart type and is instead determined by their underlying calculation models.
Side-by-Side Summary
| Feature | Trailing Band | PullBack Channel |
|---|---|---|
| Distance from Trend Line | Fixed | Dynamic |
| Band Width | Constant | Variable |
| Parallel to Trend Line | Yes | No |
| Responds to Candle Distribution | No | Yes |
| Adjusts to Market Structure | No | Yes |
| Primary Purpose | Trade Management | Pullback Analysis |
| Best Use | Profit Targets, Trailing Stops | Dynamic Support & Resistance, Pullback Evaluation |
Which One Should You Use?
The answer depends entirely on your objective.
Choose Trailing Band if you want:
- Consistent trailing stop placement
- Dynamic profit targets
- Fixed-distance trend envelopes
- Objective trade management
- Multiple extension levels using different Trailing Band Width settings
Many traders also plot multiple Trailing Bands with different widths to create layered dynamic support and resistance zones.
Choose PullBack Channel if you want:
- Better visualization of pullback depth
- Adaptive support and resistance
- Analysis of price distribution around the Trend Line
- A channel that evolves with changing market conditions
Because its width is determined by price behavior, the PullBack Channel provides a more realistic representation of how the market expands and contracts during a trend.
Conclusion
Comparing both 15-minute time-based charts and Renko charts demonstrates that the difference between Trailing Band and PullBack Channel is not dependent on chart type.
Whether the TPR Trend Line is configured for long-term, low-sensitivity tracking or medium-term, high-sensitivity tracking, their underlying behavior remains consistent.
Trailing Band always maintains a fixed, parallel distance from the Trend Line, providing a structured framework for trade management, profit targets, and trailing stops.
PullBack Channel, in contrast, dynamically adjusts its width according to the relationship between price and the Trend Line, offering a more adaptive view of pullback depth, market structure, and evolving support and resistance.
Neither approach is intended to replace the other. They address different aspects of trend analysis and complement one another. By understanding the strengths of each, traders can select the boundary method that best fits their strategy—or combine both to gain a more complete view of trend behavior across different markets, chart types, and timeframes.