Understanding Two Different Approaches to Dynamic Price Boundaries in TPR
One of the strengths of the Trend Pullback Reversal (TPR) indicator is that it offers multiple ways to visualize market structure around the TPR Trend Line. Among these, Trailing Band and PullBack Channel are often compared because both create upper and lower boundaries around the trend. However, despite looking similar at first glance, they are designed for entirely different analytical purposes.
Neither method is inherently superior. Instead, each solves a different trading problem. Understanding the difference allows traders to choose the tool that best matches their trading style.
Test Environment
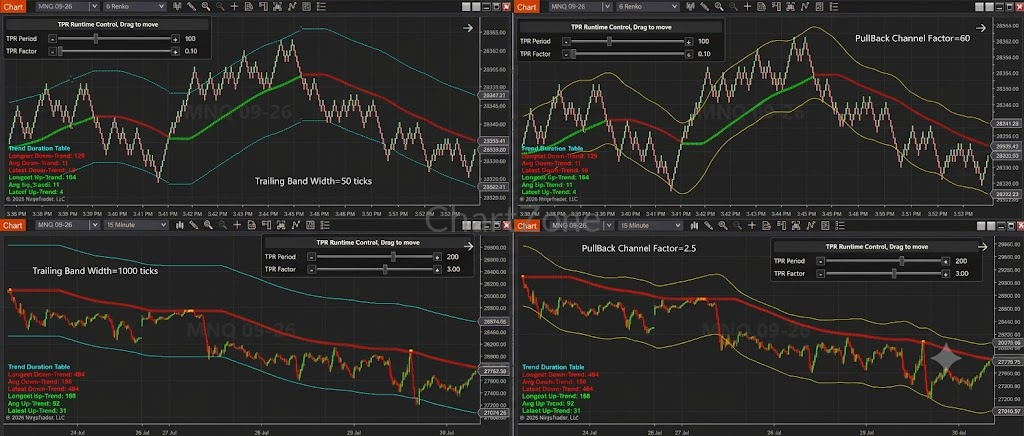
The following comparisons use identical TPR Trend Line settings while only changing the boundary calculation method.
15-Minute Chart (Long-Term Trend Tracking)
- Period = 200
- Factor = 3.0
- Long-term, low-sensitivity trend following
A larger Factor makes the TPR Trend Line less responsive to short-term price fluctuations, allowing it to focus on major market trends while filtering out smaller pullbacks.
6 Renko Chart (Medium-Term Trend Tracking)
- Period = 100
- Factor = 0.1
- Medium-term, high-sensitivity trend following
A smaller Factor allows the Trend Line to react much faster to price changes, making it more suitable for shorter-term swing trading and Renko chart analysis.
Runtime Control (TPR PRO Only)
All screenshots shown in this article were created using the TPR PRO version.
One notable feature visible in the charts is the Runtime Control panel, which allows traders to adjust the two primary TPR parameters in real time:
- TPR Period
- TPR Factor
This allows traders to immediately observe how different parameter combinations affect the Trend Line and its associated channels without opening the indicator settings or reloading the chart.
Note: Runtime Control is available only in TPR PRO. The standard version uses fixed parameters configured through the indicator settings.
Trailing Band
Fixed Distance from the Trend Line
The Trailing Band maintains a constant distance from the TPR Trend Line.
Regardless of how volatile price becomes, the upper and lower bands remain evenly spaced around the trend.
15-Minute Example
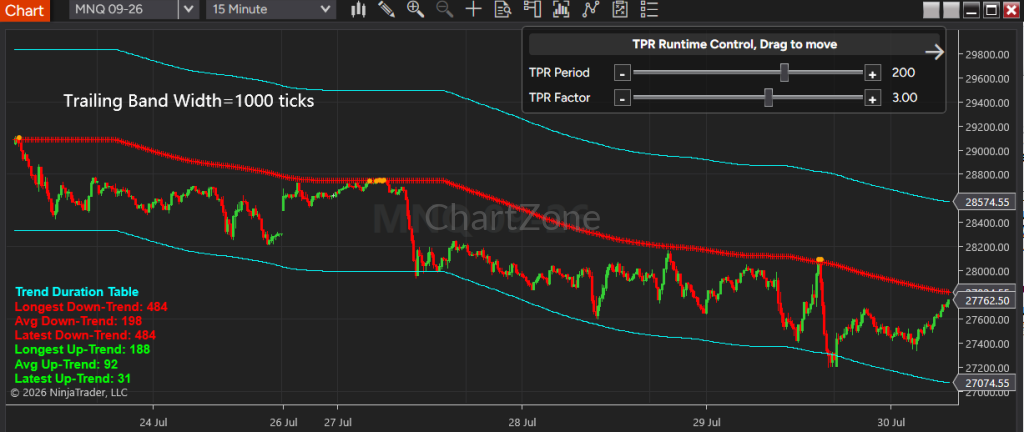
The image below uses:
- Period = 200
- Factor = 3.0
- Trailing Band Width = 1000 ticks
The cyan bands remain perfectly parallel to the red TPR Trend Line throughout the entire downtrend.
This consistent spacing provides a clean representation of a fixed statistical distance from the trend.
Characteristics
- Constant band width
- Parallel to the Trend Line
- Independent of candle distribution
- Smooth appearance
- Easy to use as dynamic profit targets
Because the distance never changes, Trailing Bands behave similarly to moving profit objectives that continuously follow the trend.
6 Renko Example

Using the more responsive configuration:
- Period = 100
- Factor = 0.1
- Trailing Band Width = 50 ticks
The same characteristic remains.
Even though the Trend Line itself reacts much faster to market movement, the cyan bands continue to maintain an identical offset from the Trend Line.
This demonstrates that Trailing Band Width is completely independent of recent candle behavior.
PullBack Channel
Dynamic Distribution Around the Trend
PullBack Channel works very differently.
Instead of maintaining a fixed distance, the channel continuously analyzes the relationship between recent candles and the Trend Line.
As price expands away from the Trend Line, the channel widens.
As price contracts, the channel narrows.
The result is a boundary that adapts to current market structure rather than remaining fixed.
15-Minute Example
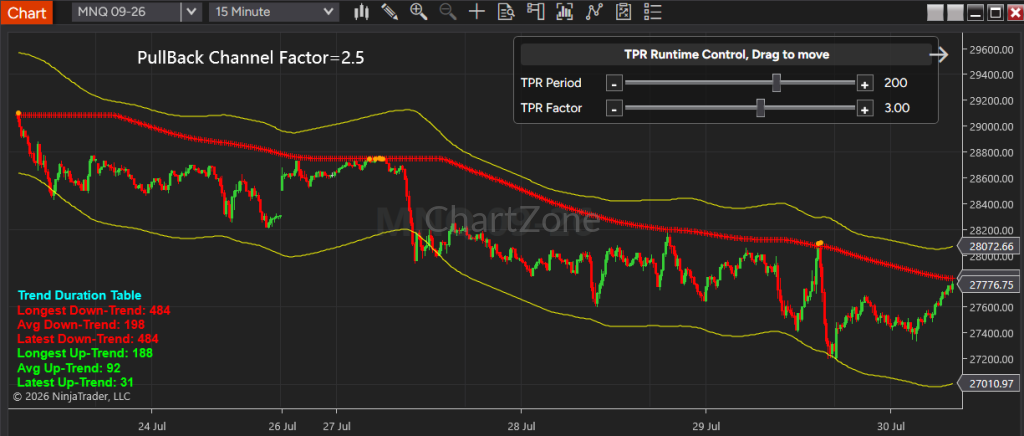
Using exactly the same Trend Line parameters:
- Period = 200
- Factor = 3.0
- PullBack Channel Factor = 2.5
Notice that the yellow channel is not parallel to the Trend Line.
Certain areas become wider while others tighten naturally according to the price distribution around the trend.
This creates a channel that better represents where pullbacks are statistically occurring instead of maintaining a fixed offset.
6 Renko Example
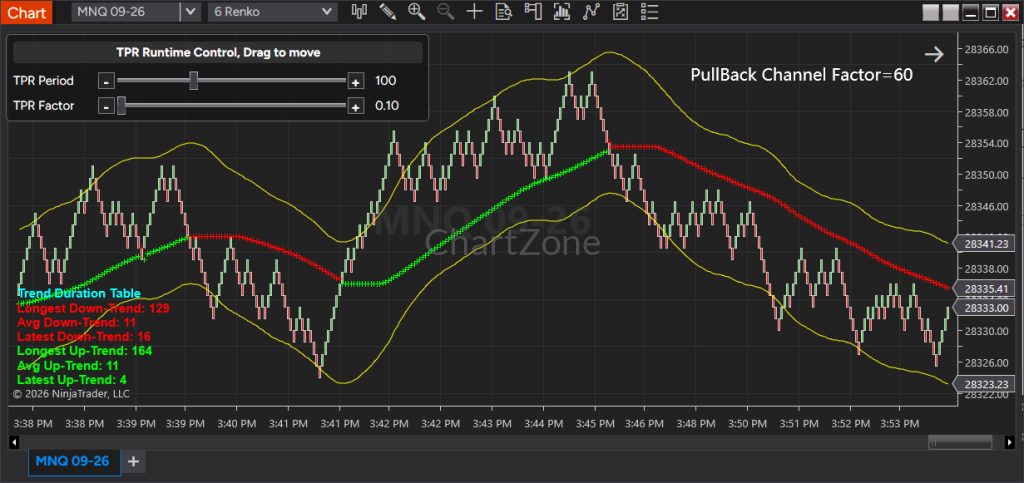
Using:
- Period = 100
- Factor = 0.1
- PullBack Channel Factor = 60
The adaptive nature becomes even more obvious.
As the Renko bricks compress during consolidations, the PullBack Channel contracts.
During stronger directional movement, the channel expands to accommodate larger pullbacks.
Instead of following a fixed mathematical distance, it follows how price is actually behaving around the Trend Line.
Direct Comparison
The difference becomes immediately apparent when comparing both methods using identical TPR parameters.
| Feature | Trailing Band | PullBack Channel |
|---|---|---|
| Distance from Trend Line | Fixed | Dynamic |
| Band Width | Constant | Continuously changing |
| Parallel to Trend Line | Yes | No |
| Responds to Candle Distribution | No | Yes |
| Adjusts to Volatility | No | Yes |
| Best Represents | Fixed trading distance | Market pullback structure |
The key observation from the uploaded charts is straightforward:
When using the same TPR Factor and Period, the Trailing Band always maintains a constant spacing from the Trend Line, while the PullBack Channel redistributes itself dynamically according to the relationship between price and the Trend Line.
This is not simply a visual difference—it reflects two different analytical philosophies.
When to Use Trailing Band
Trailing Band is particularly useful when a trader wants a consistent, rule-based distance from the trend.
Typical applications include:
- Dynamic profit targets
- Trailing stop placement
- Fixed trend envelopes
- Multi-level exit targets
- Measuring price extension from the Trend Line
Because the spacing remains constant, trade management becomes highly consistent and easy to automate.
Many traders also plot multiple Trailing Bands simultaneously using different Trailing Band Width values.
For example:
- Inner band for conservative profit targets
- Middle band for extended targets
- Outer band for extreme trend extensions
These multiple bands often behave as dynamic support and resistance zones throughout the life of a trend.
When to Use PullBack Channel
PullBack Channel is better suited for traders who want to analyze how price naturally oscillates around the Trend Line.
Rather than defining fixed distances, it helps visualize:
- Typical pullback depth
- Dynamic support and resistance
- Market expansion
- Market contraction
- Changing price behavior during trends
Since the channel adapts to current market conditions, it often provides a more realistic picture of evolving pullback structure.
This makes it especially valuable for traders looking to time pullback entries rather than manage exits.
Which One Is Better?
The answer is neither.
Trailing Band and PullBack Channel were designed to solve different problems.
Choose Trailing Band if your objective is:
- Consistent trade management
- Fixed trailing stops
- Dynamic profit targets
- Measuring trend extension
Choose PullBack Channel if your objective is:
- Understanding pullback behavior
- Identifying adaptive support and resistance
- Studying price distribution around the trend
- Evaluating changing market structure
Many experienced TPR users incorporate both tools into their workflow. A PullBack Channel can provide insight into the quality and depth of pullbacks, while one or more Trailing Bands offer predefined profit objectives and trailing stop levels. Used together, they provide complementary perspectives on the same trend rather than competing alternatives.
Conclusion
Although Trailing Band and PullBack Channel are both built around the TPR Trend Line, they represent two fundamentally different concepts.
Trailing Band maintains a fixed offset from the Trend Line, making it ideal for systematic trade management, consistent risk control, and objective profit targeting.
PullBack Channel, by contrast, continuously adapts to the evolving relationship between price and the Trend Line. Its dynamically changing width reflects how the market is actually distributing around the trend, making it particularly useful for analyzing pullback depth, identifying adaptive support and resistance, and understanding shifts in market structure.
Because they address different aspects of trend analysis, they should not be viewed as competing features. Instead, they complement one another. Traders focused on exits and position management may prefer Trailing Bands, while those seeking deeper insight into pullback dynamics may benefit more from the PullBack Channel. By selecting the tool that matches the specific objective—or combining both—TPR users can build a more complete and flexible framework for trend analysis across different markets, chart types, and timeframes.