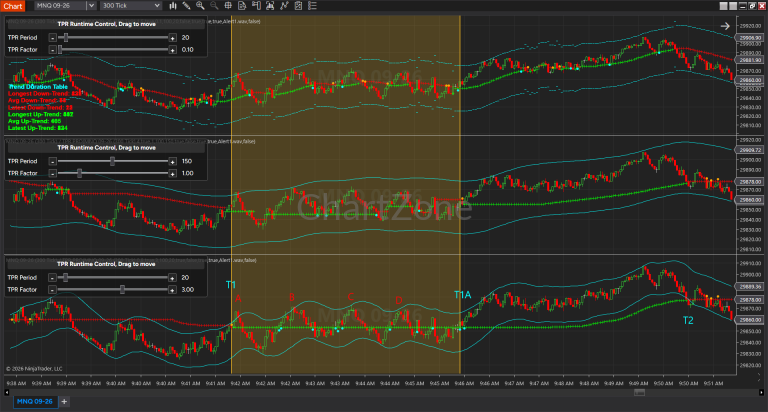
The Trend Pullback Reversal (TPR) indicator is built around two core concepts:
- Trend Line – identifies the current market trend while filtering short-term noise.
- Trailing Bands – adaptive price envelopes that expand around the Trend Line by a user-defined distance.
While most traders focus on the Factor and Period parameters when configuring TPR, the Trailing Band Width is equally important. It determines how aggressively or conservatively the Trailing Bands react to price movement, making them suitable for different trading objectives.
Unlike the Trend Line, changing the Trailing Band Width does not change the trend calculation itself. Instead, it changes only the distance between the Trend Line and the Trailing Bands, allowing traders to create multiple dynamic price zones using exactly the same trend.
The examples below demonstrate how different Trailing Band Width values influence the behavior of the bands while keeping Factor and Period identical.
Same Trend Calculation, Different Trading Zones
All charts in this example use the same trend calculation:
- Factor = 1.8
- Period = 100
These settings are intended for medium- to long-term trend tracking.
Because the Factor and Period remain unchanged, every TPR instance produces exactly the same Trend Line. The only difference between the indicators is the Trailing Band Width.
This allows multiple TPR indicators to be stacked on one chart without generating conflicting trend signals.
Instead of showing different trends, they create multiple adaptive price zones around the same trend.
Example 1 – 5-Minute Chart

The first chart uses three different Trailing Band Widths:
- 60 ticks
- 100 ticks
- 200 ticks
Each band expands from the identical Trend Line.
60-Tick Band
The 60-tick band stays very close to the Trend Line.
Its characteristics include:
- Closely follows trend movement
- Frequently interacts with price
- Excellent for aggressive trailing stops
- Suitable for short-term profit management
- Better for traders who prefer tighter risk control
Because the band sits near the Trend Line, normal market fluctuations often touch it during healthy trends.
This makes it responsive but also more sensitive to market noise.
100-Tick Band
Increasing the width to 100 ticks creates a noticeably wider trading envelope.
Compared with the 60-tick band, it:
- Reduces unnecessary stop-outs
- Better accommodates normal pullbacks
- Provides a more stable trailing level
- Works well for swing traders
The trend remains identical.
Only the allowable distance from price has increased.
200-Tick Band
The widest band creates an entirely different trading zone.
Characteristics include:
- Captures only major price swings
- Rarely touched during ordinary pullbacks
- Excellent long-term profit target
- Can serve as a higher-level resistance during uptrends
- Can serve as a lower-level support during downtrends
Instead of functioning primarily as a trailing stop, the 200-tick band often behaves as an outer market boundary.
Price frequently slows, consolidates, or reverses after reaching this area.
Multiple Bands Create Dynamic Support and Resistance
One major advantage of TPR is that multiple Trailing Bands can be displayed simultaneously.
Rather than relying on fixed horizontal levels, each band continuously adapts to changing market conditions.
For example:
- Inner Band (60 ticks)
- Short-term support/resistance
- Tight trailing stop
- Early profit-taking zone
- Middle Band (100 ticks)
- Intermediate support/resistance
- Swing management
- Pullback objective
- Outer Band (200 ticks)
- Major support/resistance
- Long-term profit target
- Trend exhaustion area
As the Trend Line moves, every Trailing Band moves with it.
The result is a fully dynamic support and resistance system that automatically adjusts to evolving market structure.
Example 2 – 300-Tick Chart

The second example uses a completely different chart type.
The Trend settings remain unchanged:
- Factor = 1.8
- Period = 100
However, the Trailing Band Widths are reduced to:
- 30 ticks
- 60 ticks
At first glance, these values appear much smaller than those used on the 5-minute chart.
Surprisingly, the market behavior is remarkably similar.
The 60-tick Trailing Band on the 300-tick chart behaves very much like the 200-tick Trailing Band on the 5-minute chart.
Both represent the widest practical price envelope for their respective chart types.
This illustrates an important concept:
The optimal Trailing Band Width depends on the chart’s price structure rather than on an absolute tick value.
Time-based charts and tick charts generate candles differently.
A width that is ideal on one chart may be far too narrow or too wide on another.
Why Does This Happen?
A 300-tick chart produces bars whenever 300 trades occur.
During active trading periods:
- bars form rapidly,
- each candle typically covers less price movement,
- trend transitions appear smoother.
As a result, a relatively small Trailing Band Width can already provide sufficient room for price fluctuations.
By contrast, a 5-minute chart compresses all trading activity into fixed time intervals.
During volatile periods, individual candles can become significantly larger.
To achieve a comparable adaptive price envelope, a substantially larger Trailing Band Width is required.
This explains why:
- 60 ticks works well on the 300-tick chart,
- while approximately 200 ticks is needed on the 5-minute chart to produce a similar effect.
The numerical values are different, but the functional role is nearly identical.
Example 3 – Using 100 Ticks on the 300-Tick Chart
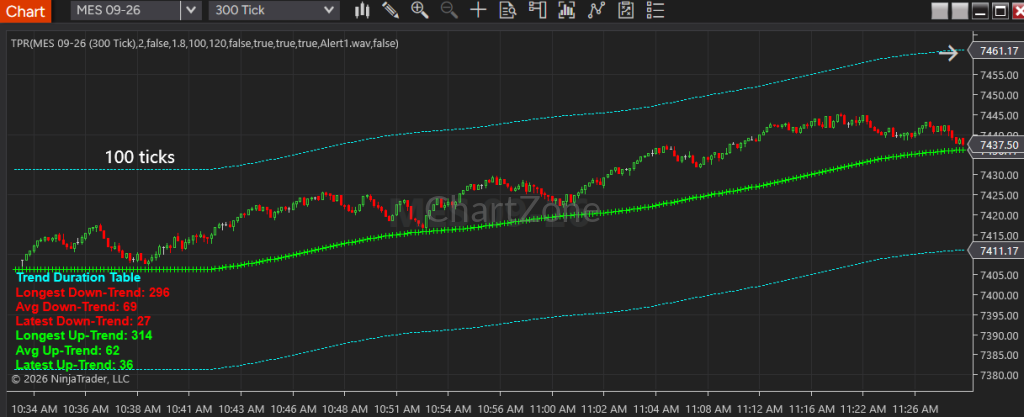
The third chart demonstrates what happens when the Trailing Band Width is increased to 100 ticks while keeping the same Factor and Period.
The result is immediately noticeable.
The Trailing Bands move much farther away from the Trend Line.
Compared with the 60-tick version:
- price rarely reaches the bands,
- pullbacks seldom touch them,
- the bands become less useful for active trade management,
- they function more as long-term market boundaries.
This clearly illustrates that simply increasing the Trailing Band Width does not necessarily improve performance.
If the bands are positioned too far from price, they provide little practical value for trailing stops or profit management because market interaction becomes infrequent.
Practical Trading Applications
One of the strengths of TPR is that multiple Trailing Bands can serve different purposes simultaneously, all while sharing the same Trend Line.
A common approach is:
| Trailing Band Width | Primary Purpose |
|---|---|
| Small | Tight trailing stop, short-term trade management |
| Medium | Swing profit target, dynamic support and resistance |
| Large | Major trend objective, long-term resistance/support, trend exhaustion zone |
Because all bands are derived from the same Trend Line, they remain perfectly synchronized throughout the trend.
This creates a structured framework for managing positions without introducing conflicting signals.
Choosing the Right Trailing Band Width
There is no universal Trailing Band Width that works across every market or chart type.
The optimal value depends on several factors:
- Chart type (time, tick, range, volume, etc.)
- Market volatility
- Average candle size
- Trading style
- Desired holding period
As demonstrated in these examples, a width that is ideal on one chart may be completely inappropriate on another, even when using identical Factor and Period settings.
Instead of thinking in terms of absolute tick values, traders should think in terms of market structure. The goal is to choose a Trailing Band Width that naturally envelopes normal price movement while remaining close enough to provide meaningful interaction with the market.
Conclusion
The Trailing Band Width is far more than a cosmetic setting. It transforms the same underlying Trend Line into a versatile framework for trade management by defining how far price can move before reaching adaptive support, resistance, profit targets, or trailing stops.
Keeping Factor and Period constant ensures that every TPR instance follows the same trend, while varying only the Trailing Band Width creates multiple dynamic price zones around that trend. This makes it possible to layer several TPR indicators on a single chart without conflicting signals, using each band for a different purpose.
The examples also demonstrate that Trailing Band Width should always be selected in the context of the chart type. A 60-tick band on a 300-tick chart can provide nearly the same practical trading envelope as a 200-tick band on a 5-minute chart, while a 100-tick band on the 300-tick chart becomes excessively wide and loses much of its value for active trade management.
Rather than searching for a single “best” width, traders should view the Trailing Band as a flexible tool. By choosing widths that match the behavior of the underlying chart and combining multiple bands around the same Trend Line, TPR can simultaneously identify dynamic support and resistance, manage trailing stops, define realistic profit targets, and provide a clearer framework for navigating trends across different market conditions.