FAQ
- TPR FAQ
FAQ about TPR indicator.
- How to Use Multiple Trailing Bands on a Single Chart
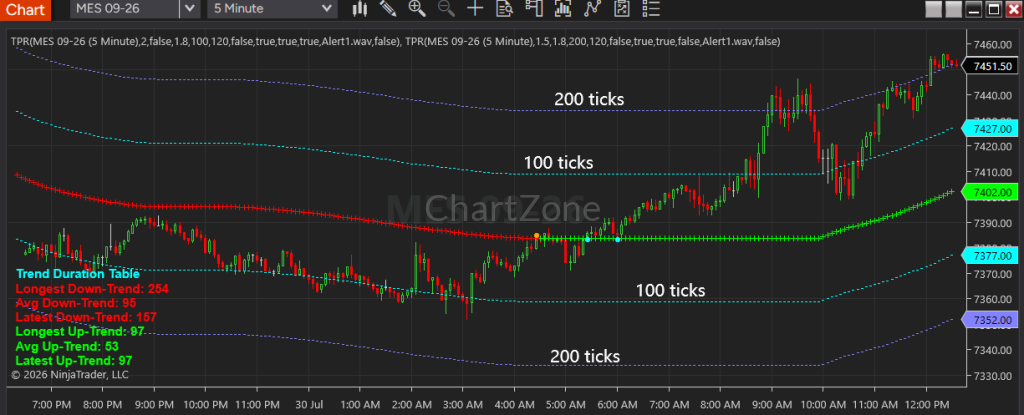
How can I display two or more Trailing Bands on the same chart at the same time?
A: You can easily add multiple Trailing Bands to a single chart by applying the TPR indicator more than once and adjusting the width parameters.
It works just like plotting two Moving Averages simultaneously (such as a 15 SMA and a 30 SMA):
- Add the TPR indicator to your chart twice (or more).
- Keep the core parameters consistent: Set the Factor and Period to the same values on all indicators so they calculate off the same baseline.
- Change the Band Width: Customise the Trailing Band Width parameter to a different value for each indicator (e.g., set Indicator #1 to
Width = 100 ticksand Indicator #2 toWidth = 2).00 ticks
Tip: Assign distinct colors or line styles to each indicator instance to easily distinguish between the different band levels on your chart.

- Why Traders Use TPR
Identify the Primary Trend
Quickly determine whether the market is in an uptrend or downtrend without being distracted by minor price fluctuations.
Separate Pullbacks from Reversals
One of the biggest challenges in trend trading is deciding whether a price move is simply a temporary pullback or the beginning of a genuine reversal.
TPR is designed specifically to help visualize these market phases.
Dynamic Trend Support & Resistance
The TPR trend line acts as dynamic support during uptrends and dynamic resistance during downtrends, making it easier to identify potential reaction areas.
Unique Pullback Channel
Unlike traditional volatility bands, the optional Pullback Channel is designed specifically around TPR’s trend model to visualize normal retracement zones within an active trend rather than standard price volatility.
Potential Reversal Signals
Optional reversal markers highlight areas where trend conditions may be changing, allowing traders to investigate possible turning points alongside their own price action analysis.
Trend Statistics
Available on supported platforms, the Trend Duration Table provides historical trend statistics, helping traders understand how the current trend compares with previous market behavior.
More Than an Indicator
TPR is not designed to provide isolated signals. It provides a structured way to interpret market behavior and organize technical analysis.
One Framework, Multiple Market Conditions
Trend, pullback, and reversal are three of the most important questions traders face in real-time market analysis. TPR brings them together within a single framework.
Adaptable to Different Trading Styles
From short-term intraday trading to longer-term market analysis, TPR can be adapted to different trading environments through its flexible parameter structure.
Built for Real-World Chart Analysis
TPR is designed to work with different markets, timeframes, and bar types, making it suitable for a wide range of trading approaches.
- Can I use the same inputs across different timeframes?
Yes.
Applying the same TPR inputs to multiple timeframes helps you:
Identify trend alignment or divergence
Judge whether short-term trends are supported by higher timeframes
Avoid trading against the dominant trend.
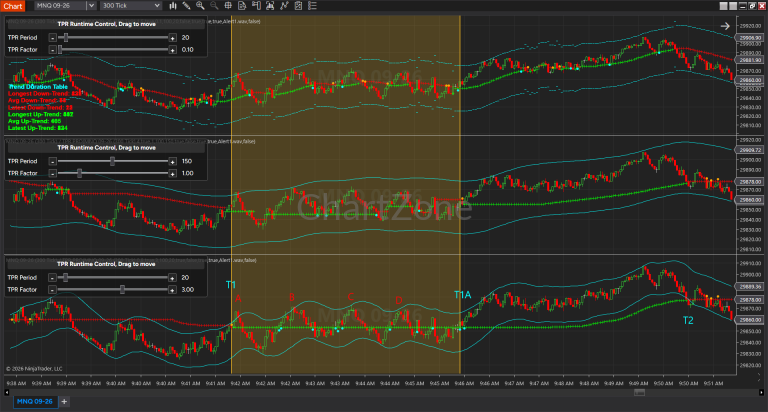
- Can I use different inputs on the same chart?
Yes, and this is highly recommended.
Using multiple TPR configurations on the same timeframe allows you to:
Compare short-term vs. long-term trend behavior
Identify dominant trend direction
Filter out weak counter-trend moves.
Please visit this link How to Use the TPR Indicator More Effectively for more details.
- Is there a “best” setting for TPR?
There is no single best setting.
The optimal input combination depends on:
Market type (FX, stocks, futures)
Volatility
Trend behavior
Timeframe
Your trading style (short-term vs. long-term)
The best inputs only exist under specific market conditions. No single combination works well in all environments.
Please visit this link and read the content to better understand how to adjust the parameters
- What does the Factor input control?
The Factor controls:
The distance between the trend line and price
The sensitivity of the indicator
How tight or loose the implied trailing stop is
In general:
Smaller Factor → more sensitive, closer to price
Larger Factor → less sensitive, farther from price
When Factor ≥ 2, the indicator becomes significantly less reactive to short-term price movement.
Visit the The impact of different Factor and Period inputs on the TPR indicator for full parameter tuning.
- What does the Period input control?
The Period controls:
How smooth the trend line is
How quickly the indicator reacts to price changes
The effective trend timescale (short-term vs. long-term)
In general:
Smaller Period → faster reaction, more short-term signals
Larger Period → smoother trend, fewer reversals, more lag
Visit the The impact of different Factor and Period inputs on the TPR indicator for full parameter tuning.
- What are the main inputs of the TPR indicator?
TPR has two primary inputs:
Period
The number of historical bars used to calculate the trend.Factor
A multiplier that determines how far the uptrend and downtrend lines are placed from price.
In most cases, Factor values below 2 are recommended. - Automatic renewals or recurring billing?
Licensing Renewal Policy
We believe in transparent, commitment-free pricing. Below are the terms governing our product trials, standard licenses, and renewal incentives.
Zero Automatic Billing Guarantee
All 1-month trials and yearly product licenses are non-recurring, fixed-term purchases. We do not implement automatic renewals or recurring subscriptions. Once your license term expires, your access will pause automatically, and you will never be billed without your explicit action.