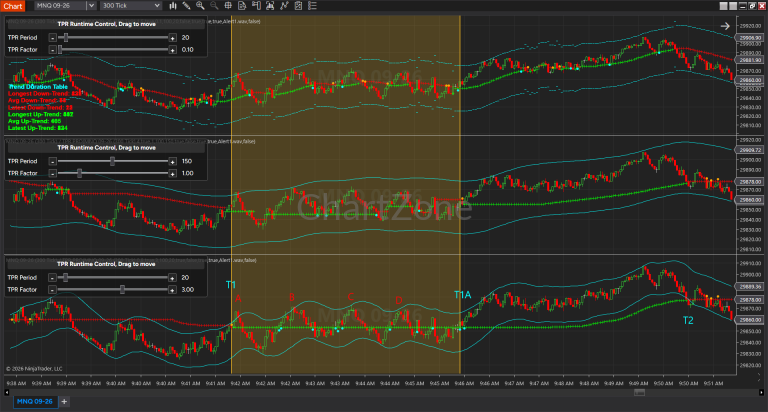
The Trend Pullback Reversal (TPR) indicator is designed to assist traders in identifying market directional changes, filtering minor market noise, and pinpointing potential pullback or rebound areas within an ongoing macro trend. It provides visual cues directly on the price chart and aggregates historical trend metrics into a clean dashboard to support quantitative decision-making. This introduction will cover the core features of the TPR indicator, how to interpret its signals, and strategies for its effective use.
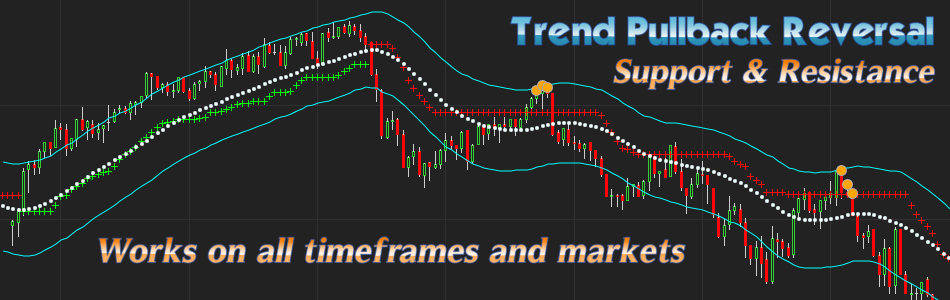
What You Will See on Your Charts.
“Clarity over complexity. TPR transforms chaotic price action into structured visual zones.”
- Up Trend / Down Trend Boundary Lines: Rendered along price bars to mark active trend direction and dynamically moving support/resistance levels. The color of the line indicates the current trend direction:
- Green Line: Indicates an uptrend.
- Red Line: Indicates a downtrend.
- Lower PullBack Channel / Upper PullBack Channel: Visual dynamic channels identifying overextended volatility expansion zones.
- Potential bullish Rebound Signal / Potential bearish Rebound Signal: Distinct color markers positioned near price highs or lows indicating potential local trend continuation or rebound conditions.
- Upper Trailing Band / Lower Trailing Band: Dynamic outer boundary lines representing fixed-tick offset levels for risk management.
The TPR indicator also includes several other features to enhance its analytical capabilities:
Signal & Channel Controls
These settings toggle secondary analytical layers designed to catch local price extremes and overextended trends.
Optimizing the PullBack Channel Factor: How It Should Change with TPR Trend Settings
- Potential Rebound Signal
- Purpose: Toggles visual alert dots on price extreme touches.
- Functionality: When enabled, highlights key locations where price action temporarily tests against existing trend boundaries, indicating high-probability rebound or pullback zones.
- Show PullBack Channel
- Purpose: Displays dynamic upper and lower volatility boundary envelopes.
- Functionality: Renders dynamic envelope lines on the chart that act as visual overbought/oversold bands relative to the central trend bias.
- PullBack Channel Factor
- Purpose: Adjusts the width of the dynamic envelope channel.
- Functionality: Expanding this factor pushes channel boundaries further away from price action, reserving alerts for extreme price extensions.
Risk & Buffer Visualizations
An extra visual feature to assist in risk management and target planning.
How Trailing Band Width Changes the Behavior of TPR: Building Dynamic Profit Targets, Trailing Stops, and Support & Resistance
- Show Trailing Band
- Purpose: Controls the display of fixed-offset trailing boundary lines.
- Functionality: Generates secondary outer boundaries parallel to current trend thresholds, providing visual assistance for stop-lossPlacement or trailing risk zones.
- Trailing Band Width in Tick
- Purpose: Sets the offset distance for trailing bands.
- Functionality: Defines the offset distance measured in minimum price increments (ticks) from the dynamic trend boundaries.
Analytical Dashboard (Trend Duration Table)
The integrated dashboard provides quantitative insights into historical trend persistence to help set realistic profit expectations.
- Show Trend Duration Table
- Purpose: Toggles the analytical dashboard overlay.
- Functionality: Displays a summary panel showing statistical breakdown metrics of historical trend durations directly on the chart screen.
- Table Position
- Purpose: Adjusts the screen alignment of the dashboard panel.
- Functionality: Allows users to position the analytical summary on the left or right edge of the chart to avoid obstructing active price action.
- Trend Duration Table: This table provides valuable statistics about the trend, including:
- Longest Up/Down Trend: The maximum number of bars a trend has persisted.
- Average Up/Down Trend: The average duration of trends.
- Latest Up/Down Trend: The duration of the most recent trend.
These metrics help evaluate trend strength, duration, and momentum, enabling users to assess whether a trend is overextended (e.g., when the latest trend approaches or exceeds historical averages or maxima, signaling potential exhaustion and pullback risks) or weakening (indicating possible reversals).
Understanding the two primary inputs: Factor and Period
The behavior of the TPR indicator can be customized through two key inputs: Factor and Period.
The Factor Input
The Factor is a multiplier that adjusts the sensitivity of the indicator. It determines the distance between the TPR line and the price.
| Factor Value | Sensitivity | Characteristics |
|---|---|---|
| Small | High | Stays close to the price, frequent reversals. |
| Medium | Moderate | Balances trend-following and noise reduction. |
| Large | Low | Far from the price, tracks long-term trends. |
A smaller Factor makes the indicator more responsive to price changes, resulting in more frequent signals, which can be useful for short-term trading but may also lead to more false signals. A larger Factor makes the indicator less reactive, filtering out minor price fluctuations and capturing longer-term trends, but with a greater lag in signaling reversals.
The Period Input
The Period input determines the number of bars used in the indicator’s calculation. A smaller Period makes the indicator more focused on recent price action, while a larger Period gives more weight to historical data, resulting in a smoother and less reactive indicator.
Detailed explanations and visual comparisons of different Factor and Period combinations are available on the dedicated parameter pages. The impact of different Factor and Period inputs on the TPR indicator.
How to Use the TPR Indicator Effectively
The TPR indicator can be used in various ways to enhance trading strategies.
To use the TPR effectively, traders often employ multi-timeframe analysis, layering short-term parameters for precise entry/exit signals and long-term ones for overall trend confirmation. For instance, prioritize the long-term TPR to establish the dominant direction (e.g., red for bearish, green for bullish), then use short-term signals to time trades while watching for divergences or alignments.
Trend Following
The most straightforward way to use the TPR indicator is for trend following. The TPR line itself can also be used as a trailing stop-loss.
Multi-Timeframe Analysis
A powerful technique is to use two TPR indicators with different parameter sets on the same chart: one with short-term settings and another with long-term settings. This allows for a multi-timeframe analysis on a single chart.
- Long-Term TPR: Establishes the primary trend direction.
- Short-Term TPR: Identifies entry and exit points within the primary trend.
When both the long-term and short-term TPR indicators are aligned (both green or both red), it provides a strong confirmation of the trend. Divergences between the two can signal potential trend reversals or corrections.
An example of Multi-Timeframe Technical Analysis by TPR
Core Performance Characteristics
- Optimized Computational Efficiency
Engineered with memory-conscious architecture. High-frequency loops and historical recalculations are streamlined to maintain zero chart latency, even on data-heavy multi-timeframe setups. - Institutional-Grade Trend Analysis Across Multiple Platforms
Experience 100% mathematical consistency across all supported trading applications. The core execution engine is mirrored precise-for-precise, eliminating discrepancy when switching between chart platforms. - Non-Repainting Signal Precision
Built for realistic backtesting and execution confidence. Once a market state is confirmed at bar-close, signal outputs remain permanently fixed to mirror real-time execution conditions. - Adaptive Volatility Noise Filtering
TPR dynamically isolates market noise during low-liquidity regimes. By filtering out range-bound micro-fluctuations, the indicator highlights actionable pullbacks within established macro trends.
Combining with Other Indicators
The TPR indicator can be combined with other technical analysis tools for more robust signals. For example, it can be used in conjunction with:
- Moving Averages: To confirm the trend and identify support and resistance levels.
- Volume: To gauge the strength of a trend.
- Momentum Oscillators (e.g., RSI, MACD): To identify overbought/oversold conditions and potential divergences.
TPR is a comprehensive trend analysis indicator that combines trend identification, pullback detection, reversal analysis, dynamic support and resistance, and optional statistical tools into a single framework. It helps traders filter market noise, analyze trends objectively, and identify higher-probability trading opportunities. Whether used as a standalone indicator or integrated into an existing trading strategy, TPR supports more consistent and informed trading decisions.